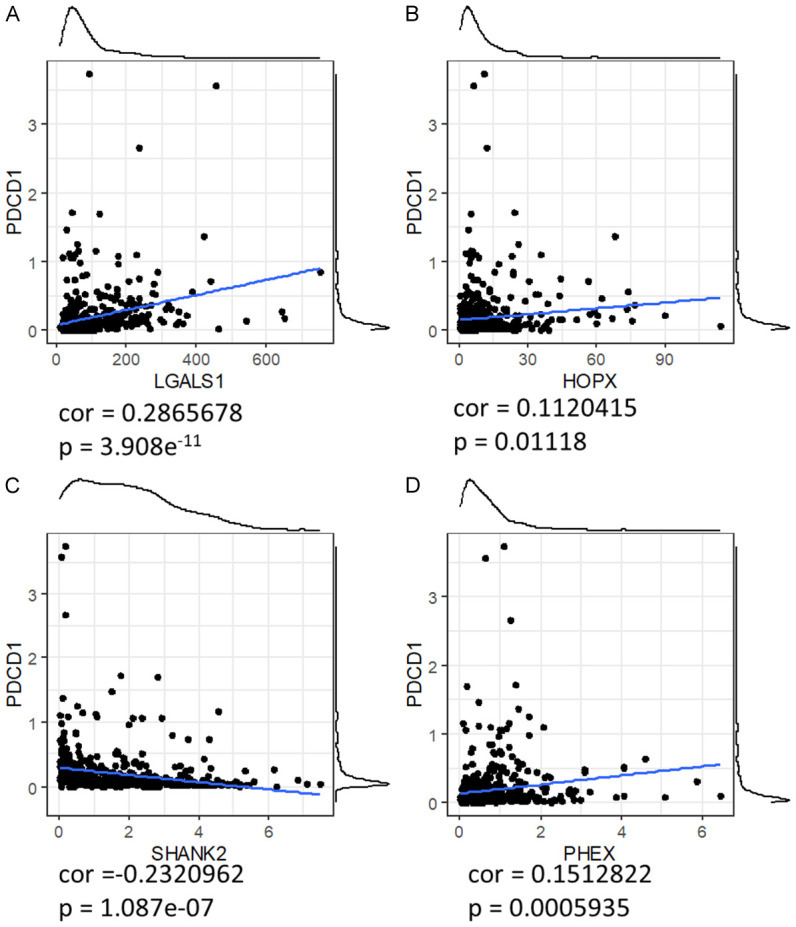
Figure 13.

Correlation between FAM-Related 4 gene expression and PDCD1 expression in low-grade glioma. (A-D) Panels show scatter plots of gene expression (X-axis) versus PDCD1 expression (Y-axis) for each of the four genes: LGALS1 (A), HOPX (B), SHANK2 (C), and PHEX (D). Each dot represents an individual patient sample. Blue lines indicate the trend lines derived from linear regression analysis. Correlation coefficients (r) are as follows: LGALS1 (r = 0.323), HOPX (r = 0.152), SHANK2 (r = -0.232), and PHEX (r = 0.151). These results demonstrate the varying degrees of association between gene expression and PDCD1 levels, highlighting the potential regulatory roles of these genes in immune checkpoint pathways.
