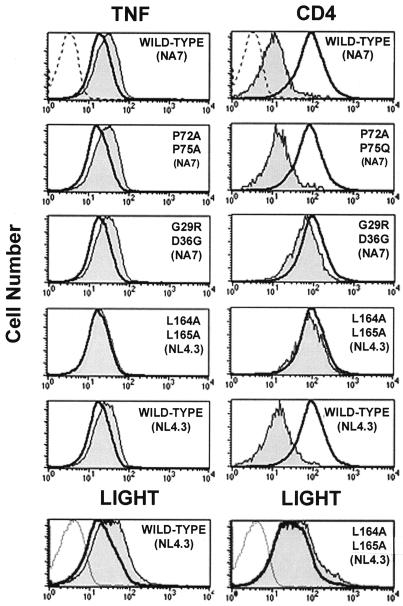
FIG. 4.
Mutational analysis of Nef-induced TNF up-modulation. II-23.D7 cells were electroporated with 20 μg of pCG plasmids encoding either wild-type or mutant versions of a Nef-GFP fusion protein. After 24 h, cells were either mock treated and stained with a CD4-specific MAb (top right panels), activated with PMA-ionomycin for 5 h and analyzed with a TNF-specific MAb (top left panels), or activated with PMA-ionomycin for 20 h and analyzed with HVEM-Fc (bottom panels). Histograms represent cell surface levels of TNF, CD4, or LIGHT in transfected (GFP-positive; shaded areas) or untransfected (GFP-negative; heavy solid lines) cells. Staining controls with isotype-matched antibodies are indicated by light lines.

