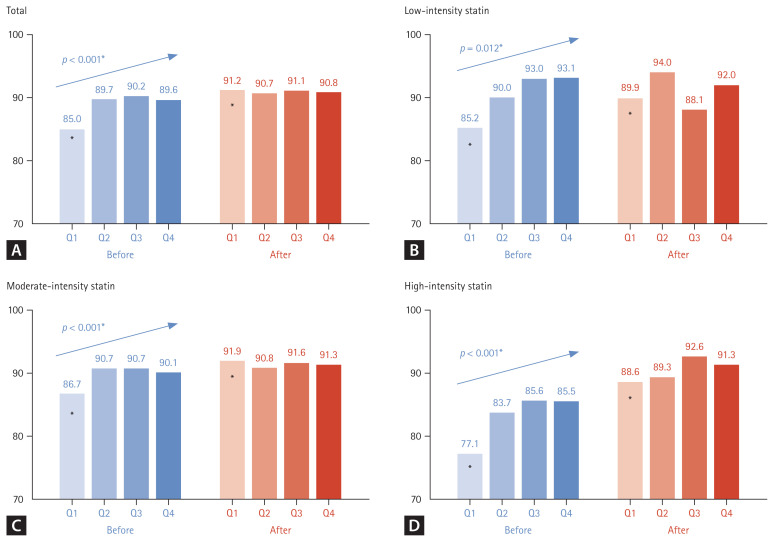
Figure 3.
Changes in the proportion of patients with normal CPK levels according to TSH quartiles before and after statin administration. CPK, creatinine phosphokinase; TSH, thyroid-stimulating hormone; ANOVA, analysis of variance. Tukey’s honest significance difference test was applied for post-hoc analysis (before), with p < 0.05 compared with the initial value (after). *p < 0.05 compared with Q2, Q3, and Q4 by one-way ANOVA and post-hoc analysis.

