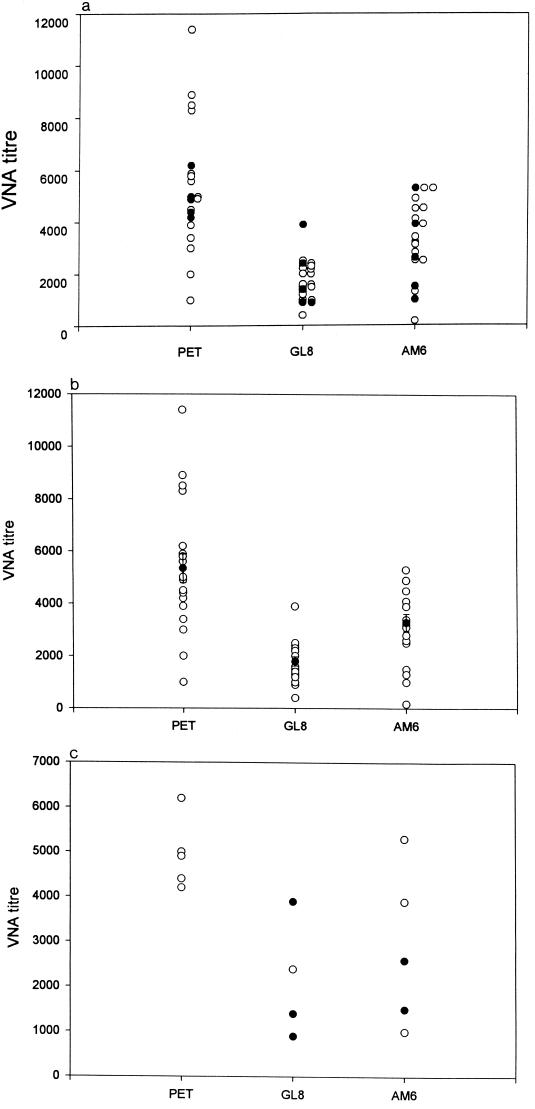
FIG. 4.
(a) Scatter plot of day-of-challenge VNA titers of the inactivated virus vaccinates against the three challenge isolates of FIV (open symbols), indicating the cats that were subsequently challenged with each of the isolates (closed symbols). (b) Scatter plot of day-of-challenge VNA titers of the three groups of inactivated virus vaccinates measured against the homologous challenge virus isolate, with the mean titers ± SEM superimposed (closed symbols). (c) Scatter plot of day-of-challenge VNA titers of the inactivated virus vaccinates measured against the homologous challenge virus isolate. The vaccinates that became infected following challenge are indicated by the closed symbols.

