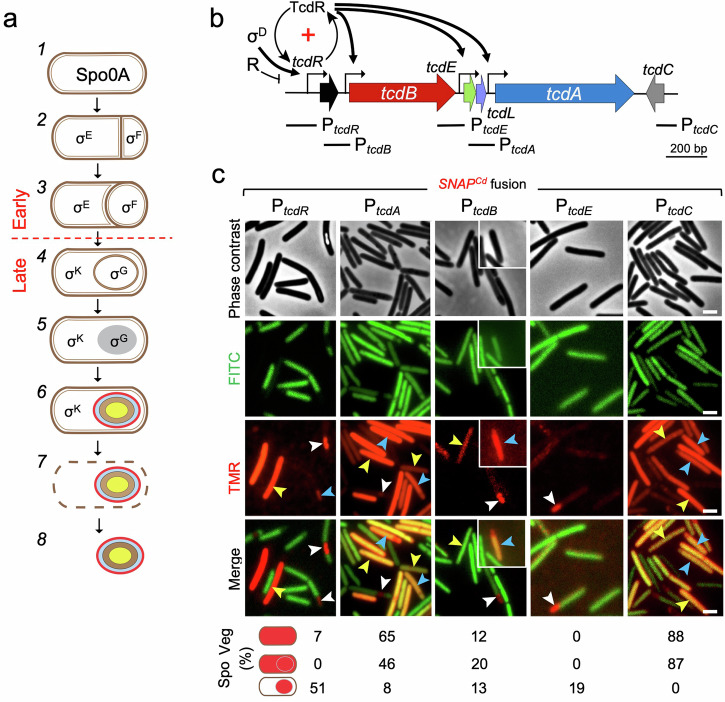
Fig. 1. Expression of the PaLoc genes during C. difficile growth and sporulation.
a Shown is the pathway of spore differentiation starting with vegetative (pre-divisional cells, (1), asymmetric division (2), a stage in engulfment (3), engulfment completion (4), synthesis of the spore protective layers (5 and 6) and free mature spores (8), resulting from mother cell lysis (7). Spo0A controls several stationary phase processes and is also essential for entry into sporulation. Cell type-specific gene expression results from the action of the indicated σ factors. Early and late stages in development are defined as those occurring prior to or following engulfment completion, as indicated. b Genetic organization of the PaLoc. Broken arrows represent promoters in the region; the TcdR positive auto-regulatory loop (“+” sign) and the role of σD in its priming are indicated. The black arrows represent direct regulation of the indicated promoters by TcdR. Other direct or indirect regulatory factors that impinge onto the expression of the PaLoc-encoded genes are collectively represented by “R”. The lines below the genetic map show the position and extent of the DNA fragments used to create the indicated transcriptional SNAPCd fusions. Note that the PtcdR fragment includes two tcdR-dependent promoters (P1 and P2), the σD-dependent promoter and a σA-type promoter (see also Fig. 3). c Cell type-specific expression patterns of PtcdR-, PtcdA-, PtcdB-, PtcdE- and PtcdC-SNAPCd transcriptional fusions in strain 630Δerm. The cells were collected 24 h after inoculation in TY liquid medium, labeled with TMR-Star and examined by phase contrast and fluorescence microscopy to monitor SNAPCd production. The merged images show the overlap between the TMR-Star (red) and the auto-fluorescence (green) channels. The images are representative of the expression patterns observed for the different fusions in three independent experiments. Yellow arrowheads point to vegetative cells with expression, white arrowheads point to sporulating cells with forespore-specific expression and blue arrowheads point to sporulating cells with a whole sporangium expression pattern. The various cellular patterns of SNAPCd production were scored and their percentage relative to the total number of vegetative (Veg) or sporulating cells (Spo) is shown. The images are representative of the expression patterns observed for the different fusions in three independent experiments (see also Fig. S1 and the Methods section). For sporulating cells the scoring includes a whole sporangium expression pattern and a forespore-specific pattern. The number of cells analyzed for each fusion, n, is as follows: PtcdA-SNAPCd, n = 245; PtcdB-SNAPCd, n = 410; PtcdC-SNAPCd, n = 400; PtcdE-SNAPCd, n = 579; PtcdR-SNAPCd, n = 353. Scale bar, 1 μm.

