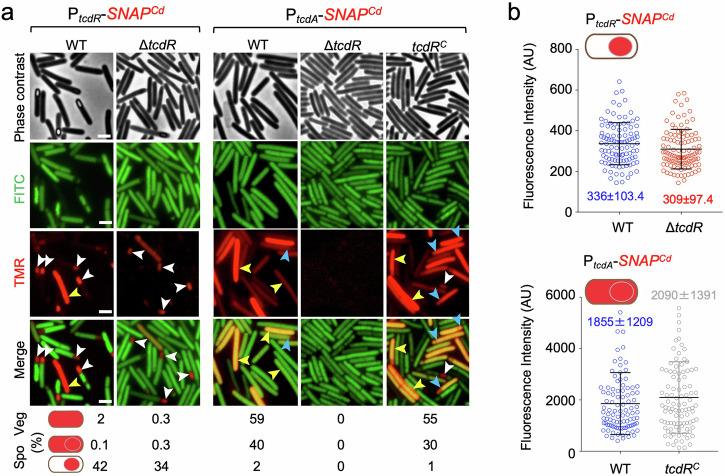
Fig. 2. The role of TcdR in regulating toxin production.
a Microscopy analysis of C. difficile cells carrying transcriptional fusions of the tcdR and tcdA promoters to SNAPCd in strain 630Δerm (WT), in the ΔtcdR mutant and in the ΔtcdR mutant complemented with the wild-type allele at the pyrE locus (tcdRC). The cells were collected after 24 h of growth in TY liquid medium, labeled with TMR-Star and examined by phase contrast and fluorescence microscopy to monitor SNAP production. The merged images show the overlap between the TMR-Star (red) and the auto-fluorescence (green) channels. The images are representative of the expression patterns observed for the different fusions in three independent experiments (see also Fig. S1b and the Methods section). Yellow arrowheads point to vegetative cells with expression, white arrowheads point to sporulating cells with forespore-specific expression and blue arrowheads point to sporulating cells with whole sporangium SNAPCd production. The numbers below the panels show the percentage of vegetative (Veg) cells and sporulating cells (Spo) with the represented patterns. The number of cells analyzed for each strain, n, is as follows: WT with PtcdA-SNAPCd, n = 918; tcdRC with PtcdA-SNAPCd, n = 820; WT with PtcdR-SNAPCd, n = 1456; ΔtcdR with PtcdR-SNAPCd, n = 2246; tcdRC with PtcdR-SNAPCd, n = 2688. Scale bar, 1 μm. b Quantitative analysis of the fluorescence intensity (in Arbitrary Units, AU) of the SNAPCd signal per forespore for the tcdR fusion and in whole sporangia for the tcdA fusion, in the WT or in the ΔtcdR and tcdRC strains; the data refers to the experiments described in (a). The numbers inside the graphs represent the mean value ± the standard deviation. All pairwise comparisons were non-significant (see Methods).

