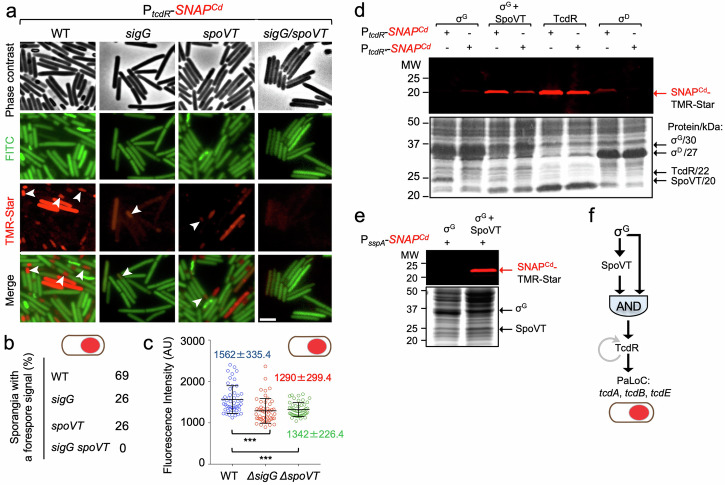
Fig. 4. Toxin production in the forespore is dependent on σG and SpoVT.
a Strains of C. difficile carrying a fusion of the tcdR regulatory region to SNAPCd in strain 630Δerm (WT) and in the sigG, spoVT and sigG/spoVT were grown in TY medium and cells collected after 24 h of growth. The cells were labeled with TMR-Star and examined by phase contrast and fluorescence microscopy. The merged images show the overlap between the TMR-Star (red) and the auto-fluorescence (green) channels. The images are representative of the PtcdR-SNAPCd expression patterns seen in three independent experiments, with white arrowheads identifying forespore-specific expression. Scale bar, 1 μm. b Shows the percentage of sporangia with a forespore-specific signal for the indicated strains. The number of cells analyzed for each strain, n, was: WT, n = 450; sigG, n = 878; spoVT, n = 540; sigG/spoVT, n = 500. c Fluorescence intensity (in Arbitrary Units, AU) of the SNAPCd signal in the forespore for the PtcdR-SNAPCd fusion in the WT or congenic sigG and spoVT mutants. Note that no signal was detected for the sigG/spoVT double mutant. The numbers in the panels represent the mean value ± the standard deviation. ***, p < 0.001 (see Methods); d E. coli BL21(DE3) derivatives with plasmids carrying PtcdR- or PtcdR*-SNAPCd fusions, as indicated, were transformed with compatible plasmids for the induction of σG, σG, and SpoVT, TcdR or σD. e As in (d), except that E. coli BL21(DE3) containing a plasmid with a PsspA-SNAPCd fusion was transformed with plasmids for the induction of σG alone or together with SpoVT, as indicated. In (d) and (e), the various proteins were produced through auto-induction, whole cell extracts prepared, labeled with TMR-Star, proteins resolved by SDS-PAGE, and the gels scanned on a fluoroimager (top) before Coomassie staining (bottom). The position of the various regulatory proteins is indicated by black arrows and their molecular weights are given on the right side of (d). The position of the SNAPCd-TMR-Star complex is indicated by the red arrows. The regions shown in panels d and e were cropped from original gels shown in Supplementary Fig. S10. f Representation of the coherent feed-forward loop formed by σG and SpoVT, with an AND gate logic, though to lead to delayed production of TcdR in the forespore, and to the expression of the PaLoc genes tcdA, tcdB, tcdR, and tcdE in this cell.

