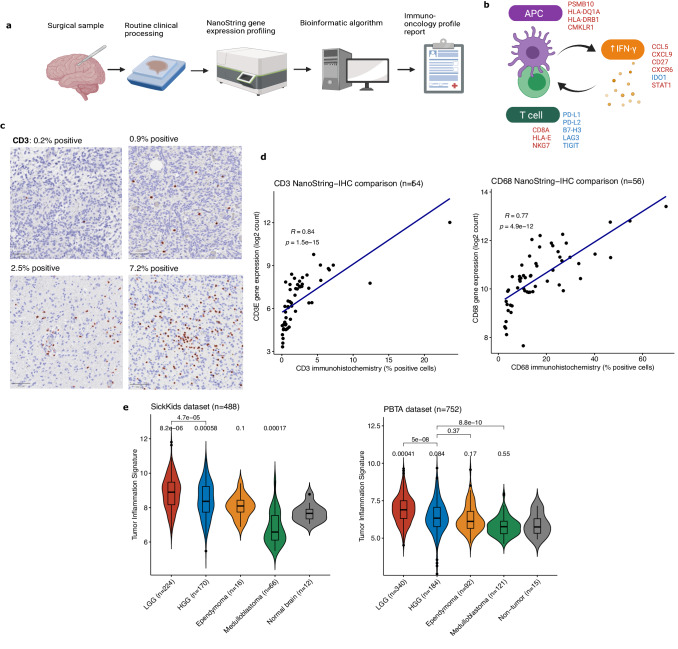
Fig. 1. Overview of workflow, assay validation, and immune-oncologic profiling of pediatric brain tumors.
a Schematic of immune-oncology profiling workflow using clinical tumor samples. Created with BioRender.com. (APC: antigen-presenting cell). b Diagram of 18 genes included in tumor inflammation signature (TIS) in relation to immune activation (red text denotes genes that increase immune activity and blue denotes genes that decrease immune activation). Created with BioRender.com. c Images of digital quantification of CD3 IHC. Representative areas of whole slide images were selected for visualization, with the percentage of positive cells in the entire slide indicated. Scale bar (bottom left) is 100 μm. Images taken at 100x magnification. d Scatter plots of correlation between gene expression by NanoString and percentage of positive cells by IHC for CD3 and CD8 in matched tissue sections. Correlation and p-values were calculated using the Spearman correlation. (e) Violin plots of TIS scores across major pediatric tumor types from SickKids and PBTA datasets, compared to non-tumor brain controls. Boxes show the median and interquartile range (IQR) of the data with whiskers extending to ±1.5 IQR. p-values calculated using two-tailed T test with Holm adjustment. (HGG: high-grade glioma; LGG: low-grade glioma).

