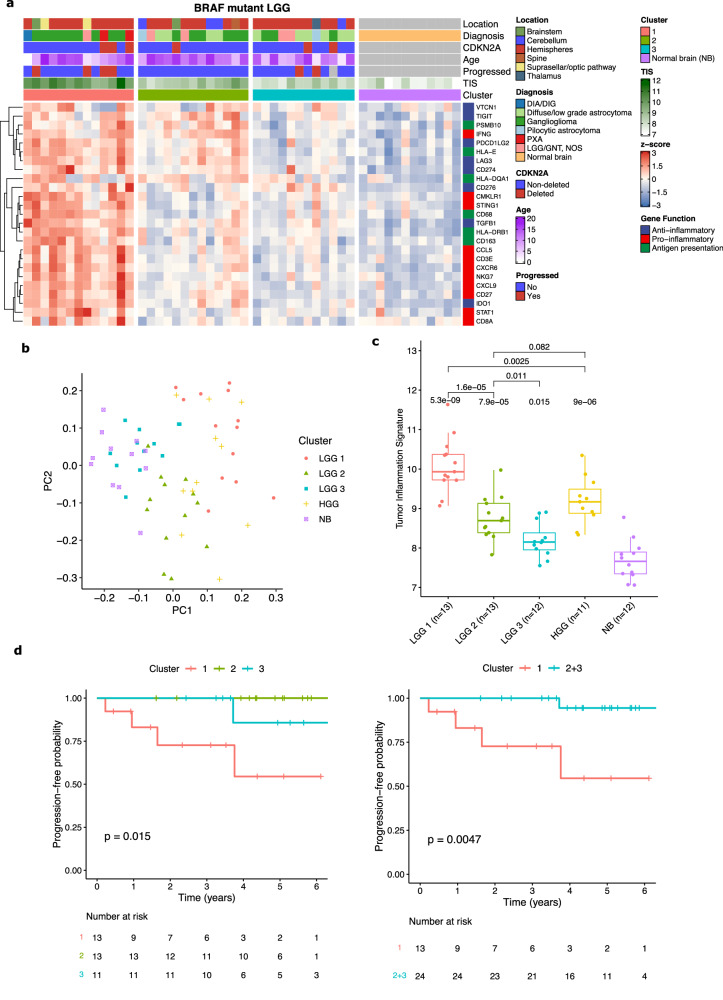
Fig. 4. Clusters of immunologic response in BRAF V600E mutant LGG.
a Heatmap of three distinct immunologic clusters of BRAF mutant LGG showing expression of selected genes of interest. (DIA/DIG: desmoplastic infantile astrocytoma/ganglioglioma; PXA: pleomorphic xantho-astrocytoma; LGG/GNT NOS: low-grade glioma/glioneuronal tumor, not otherwise specified; NB: normal brain). b PCA plot of three LGG clusters and BRAF V600E mutant PHGG compared to normal brain. c Boxplot of TIS scores for three LGG clusters and BRAF V600E mutant PHGG compared to normal brain. Boxes show the median and interquartile range (IQR) of the data with whiskers extending to ±1.5 IQR. P-values by two-tailed T test with Holm adjustment. d Kaplan-Meier curves of progression-free survival for the three LGG immune clusters and of cluster 1 compared to cluster 2 + 3. P-values by log-rank test.

