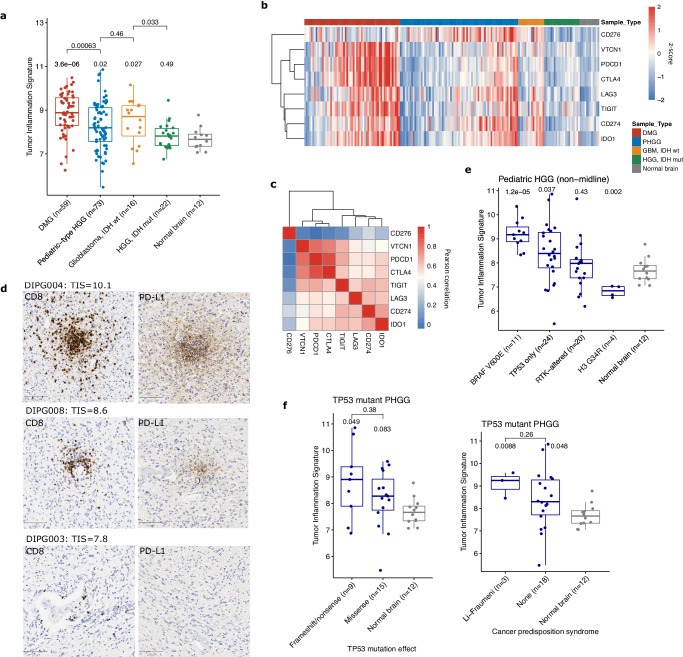
Fig. 5. Elevated inflammation levels in pediatric-type HGG.
a Boxplot of TIS across pediatric and adult-type HGGs. Boxes show the median and interquartile range (IQR) of the data with whiskers extending to ±1.5 IQR. P-values by two tailed T test with Holm adjustment. (DMG: diffuse midline glioma; IDH: isocitrate dehydrogenase). b Heatmap of gene expression of immune checkpoints and other inhibitory markers across HGG types. Values represent log2 gene counts scaled to mean = 0 and standard deviation = 1. (PHGG: pediatric-type HGG). c Heatmap of Pearson correlation between immune checkpoint gene counts on NanoString. d Representative images of CD8 and PD-L1 IHC from 3 diffuse midline gliomas. Scale bar (bottom left) is 100 μm. Images taken at ×100 magnification. e Boxplot comparing TIS scores for genetically defined subtypes of pediatric hemispheric HGG. Boxes show median and IQR with whiskers extending to ±1.5 IQR. P-values by two-sided T test with Holm adjustment. (RTK: receptor tyrosine kinase). f Boxplots for HGGs with only TP53 mutations identified, comparing protein-altering effect of mutation, and germline status of TP53 mutation. Boxes show median and IQR with whiskers extending to ±1.5 IQR. P-values by two-sided Wilcoxon rank sum test, unadjusted.

