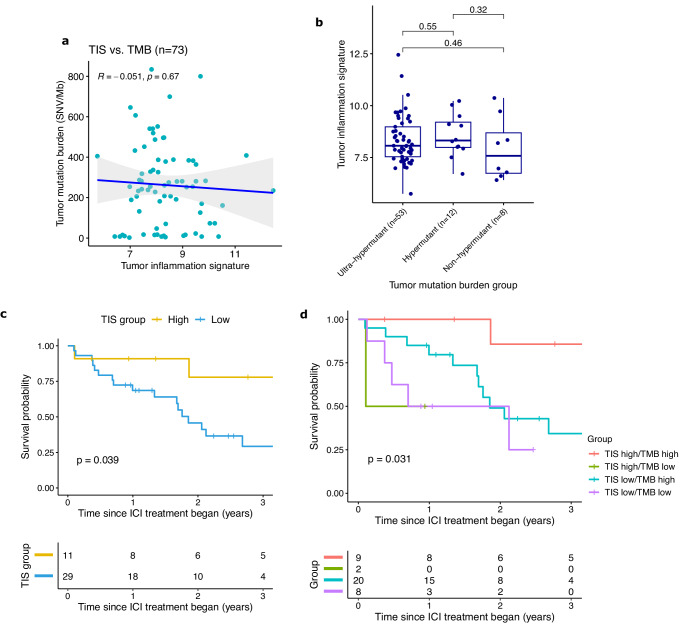
Fig. 6. TIS as a biomarker for immunotherapy response in mismatch repair deficient HGG.
a Scatterplot of tumor inflammation signature (TIS) vs. tumor mutation burden (TMB) in MMRD HGG. Correlation and P-values using Spearman correlation coefficient. Error bands represent the 95% confidence interval. b Boxplot of TIS split by TMB groups of ultra-hypermutant (TMB > 100 SNV/Mb), hypermutant (TMB 10-100), and non-hypermutant (TMB < 10). Boxes show the median and interquartile range (IQR) of the data with whiskers extending to ±1.5 IQR. P-values by two-tailed T test without adjustment. c Kaplan–Meier curves of overall survival for MMRD HGG treated with ICI, split by high (TIS > 9) and low inflammation. P-value by log-rank test. d Kaplan–Meier curves of overall survival for MMRD HGG treated with ICI, separated into 4 groups by TIS high/low status and TMB high/low status. P-value by log-rank test.

