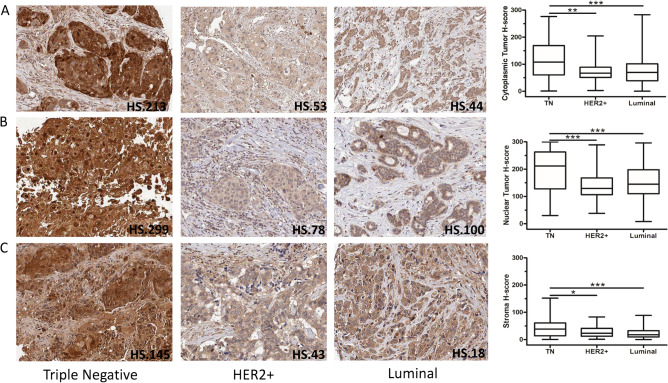
Figure 3.
IHC staining of Maspin in samples of primary breast cancer tumors and its expression profile in different molecular subgroups. Image above representative photomicrographs of tumor tissues classified as high and low for Maspin in the TN (A and D, respectively), HER2+ (B and E, respectively) and Luminal (C and F, respectively) subtypes. Image below IHC expression levels of Maspin between the different molecular groups and according to the cytoplasmic and nuclear location in breast cancer cells (A and B, respectively). IHC expression levels of Maspin between the different molecular groups and according to the protein present in the tumor microenvironment (C). Statistical analyzes of the box plots were performed using the t-student or Mann–Whitney test as appropriate, with data expressed as mean ± s.e.m. (standard error). The following H-score medians were obtained for the Maspin: Cytoplasm 71.07, Nucleus 145.84, and Stroma 19.32, and subsequently, Kaplan Meyer (KM) curves were elaborated according to follow up patients’ data. *p < 0.05; **p < 0.01; ***p < 0.001.

