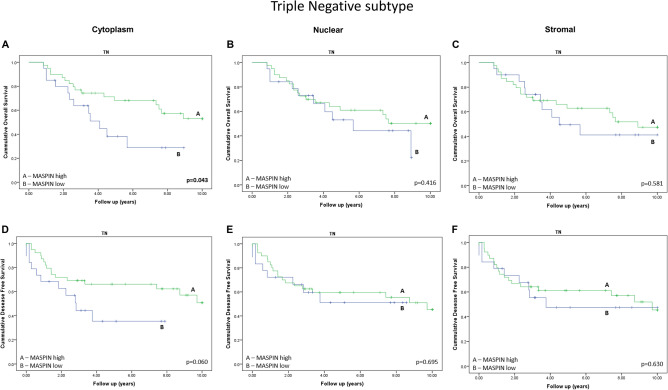
Figure 4.
Kaplan–Meier curves for overall survival (OS) and disease-free survival (DFS) of patients with breast cancer of the TN subtype stratified according to the Maspin expression. The OS curves (A, B and C) and DFS curves (D, E and F) were calculated for each group of patients. All cases were classified as high or low expression for Maspin. (A) and (D) Evaluation of cytoplasmic immunostaining. (B) and (E) Evaluation of nuclear immunostaining. (C) and (F) Stromal immunostaining assessment.

