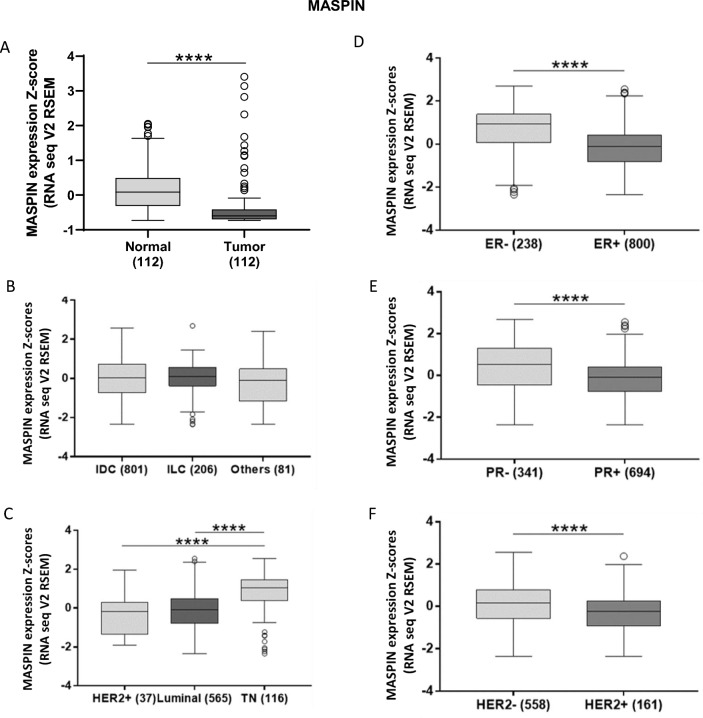
Figure 5.
Expression profile of Maspin in different tissue and molecular contexts. (A) Differential expression of Maspin in normal and tumoral breast tissue, (B) in different histopathological subtypes and (C) in different molecular subtypes of breast cancer. On the right, expression profile of Maspin in breast cancer according to classical breast cancer biomarkers. (D) Expression of Maspin and the estrogen receptor. (E) Maspin and the progesterone receptor, and (F) expression of Maspin and HER2, respectively. *p < 0.05; **p < 0.01; ***p < 0.001; ****p < 0.0001. Results based on TCGA data.

