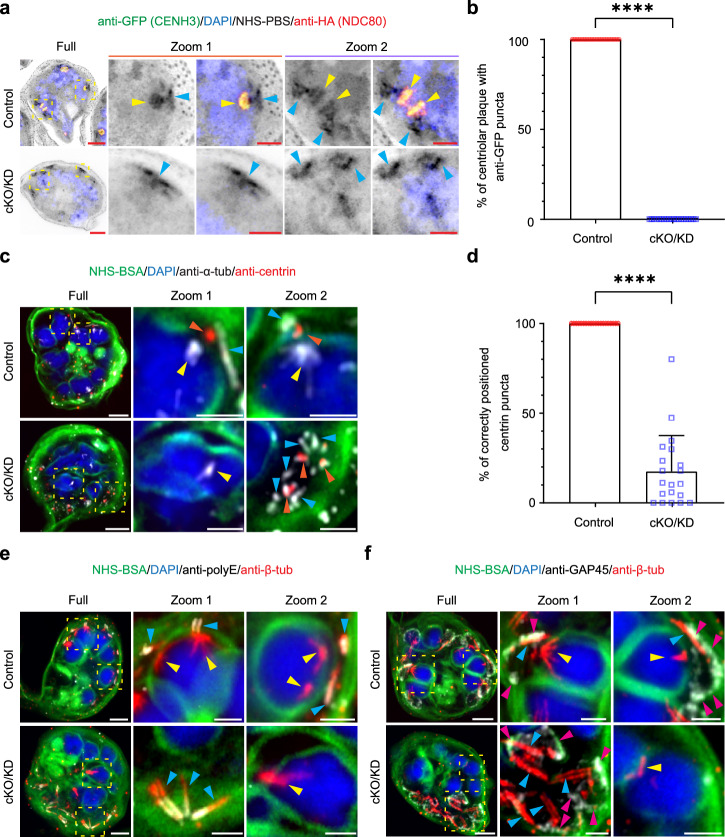
Fig. 3. PfNDC80 is required for correct positioning of centromeres, the outer centriolar plaque and the apical complex.
a Representative U-ExM micrographs of PfNDC80-HA/GFP-PfCENH3 control and conditional knockout/knockdown (cKO/KD) mid stage schizonts counterstained with the general protein dye NHS-PBS (inverse grayscale). The anti-HA (PfNDC80-HA, red) labelling overlaps with the anti-GFP (GFP-PfCENH3, green) labelling (yellow arrowheads). In cKO/KD cells, NHS-PBS-labelled apical complex (aqua arrowheads) is separated from the DAPI-labelled nucleus (blue). The anti-GFP signal is also lost. Additional images are presented in Supplementary Fig. 10. The experiment was performed 3 times. b Analysis of the percentage of centriolar plaque structures (labelled with NHS-PBS) associating with anti-GFP puncta in anti-HA-positive control and anti-HA-negative cKO/KD PfNDC80-HA/GFP-PfCEH3 cells (34 and 36 hpi). Control, n = 20; cKO/KD, n = 20. The mean and standard deviation are plotted. Individual data points are shown. An unpaired Mann–Whitney t-test was performed (****p < 0.0001). The images for quantifications were acquired from 3 independent experiments. Figure 3a, b experiments were repeated 3 times. c In late stage schizonts (38 hpi), anti-centrin labels the outer centriolar plaque (red, orange arrowheads), while anti-α-tubulin (greyscale, anti-α-tub) labels the sub-pellicular (aqua arrowheads) and spindle remnant (yellow arrowheads) microtubules. Additional images are presented in Supplementary Fig. 11a, b. The experiment was performed two times. d Analysis of centrin puncta positions. Control, n = 20; cKO/KD, n = 20. The mean and standard deviation are plotted. Individual data points are shown. An unpaired Welch’s t-test was performed to test significance (****p < 0.0001). The images for analysis were acquired from 2 independent experiments. Figure 3c, d experiments were repeated 2 times. e Late stage mitotic schizonts (38 hpi). The sub-pellicular microtubules (aqua arrowheads) are distinguished by labelling with anti-β-tubulin (red, anti-β-tub) and anti-polyE (greyscale). The experiment was performed one time. f The inner membrane complex is labelled with anti-PfGAP45 (greyscale, magenta arrowheads, anti-GAP45). The post-mitotic spindle remnant, inside the nucleus, is labelled with anti-β-tubulin (red, yellow arrowheads). Additional images are presented in Supplementary Fig. 11c, d. The experiment was performed twice. The images are displayed as z-projections. All the image scale bars are 5 μm, except the zoom images, which are 2 μm.

