
Fig. 3. Diazotroph abundances across fertilization treatments.
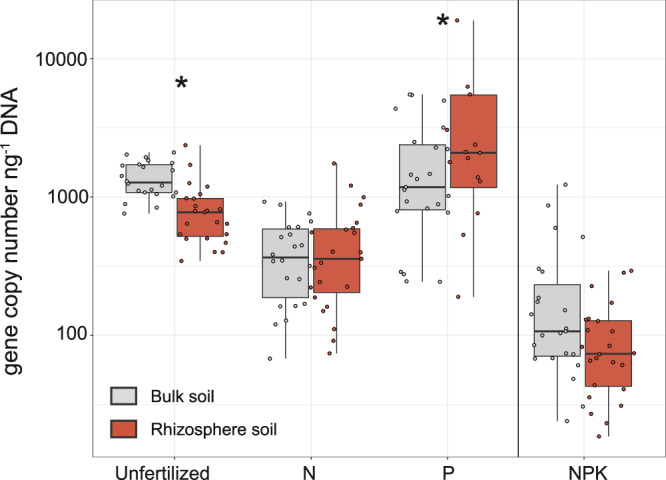
Abundances obtained by qPCR quantification of nifH gene in bulk (gray) and rhizosphere soil (red) of all investigated plants across different fertilization treatments. Unfertilized, N and P field treatments were sampled in 2014, and NPK treatment was sampled in 2018. The upper and lower hinges indicate the first and third quartiles. Significant differences (p < 0.05) based on ANOVA results between both microenvironments are indicated (*). Exact sample sizes: unfertilized (n = 45 biologically independent samples), N (n = 45 biologically independent samples), NPK (n = 47 biologically independent samples), P (n = 44 biologically independent samples).