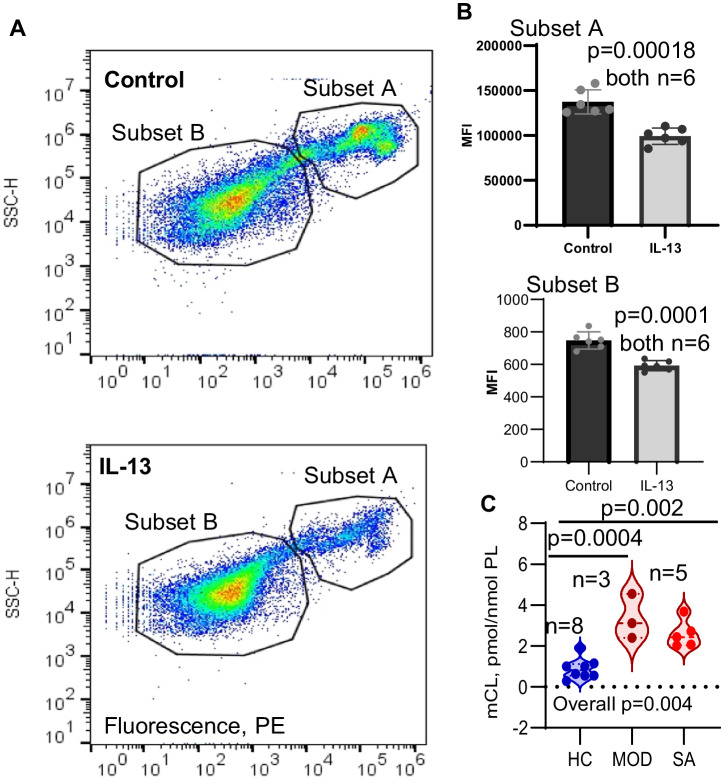
Fig. 3. IL-3 treatment decreases mitochondrial membrane potential in HAEC.
HAECs were cultured with media alone under ALI for 9 days and then stimulated or not with IL-13 for 5 days before harvested for membrane potential assessment by Tetramethylrhodamine, methyl ester (TMRM). A Scatter plot of side-scatter intensity versus TMRM fluorescence intensity for untreated (upper panel) and IL-13 treated cells (bottom panel). B The mean of fluorescence intensities (MFI) of subset A and subset B in control and IL-13 treated cells. Data are presented as mean ± s.d, and significance analyzed by unpaired T-testing of n = 6 biological replicates. C LC/MS analysis showing elevated levels of mCLs in Mild-Moderate (MOD) and Severe Asthma (SA) as compared to HC samples (LC/MS analysis). Differences were determined by one-way ANOVA followed by intergroup unpaired t-testing of n = 3 to 8 biological samples per group from individual donors (see Table 1 for details). oxCL data in Supplementary Fig. 3. Source data are provided as a Source Data file.

