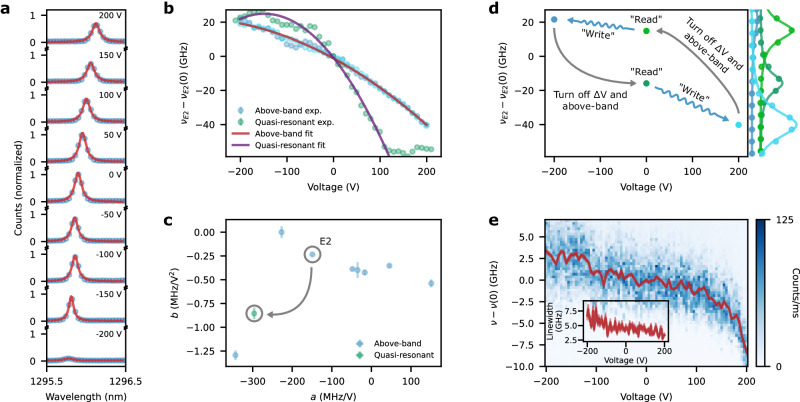
Fig. 4. Frequency tuning of individual quantum dots.
a, Emission spectrum and corresponding Lorentzian fits of emitter 2 (E2) under above-band illumination while voltages within ± 200 V are applied to the device. b Center wavelength of the Lorentzian fits shown in a in addition to data for other applied voltages, while the emitter is quasi-resonantly excited. c Best quadratic fit parameters, a and b, to the shift experienced by eight different emitters extracted by fitting data of the type shown in (b). Error bars correspond to one standard deviation of the fitted parameter (see the “Methods” section). d Emission frequency of the quantum dot, νE2, relative to its emission frequency at zero bias with above-band excitation, νE2(0), while writing it with above-band illumination at a bias and later reading them under quasi-resonant excitation with zero bias. The unbiased quasi-resonant spectra feature emission frequency shifts arising from the write step. e Photoluminescence excitation spectra of the resonance fluorescence from a biased quantum dot, where the red line indicates the average emission frequency of the spectra, ν, relative to the dot’s emission frequency at zero bias, ν(0). Inset: Fitted linewidth of the spectra.

