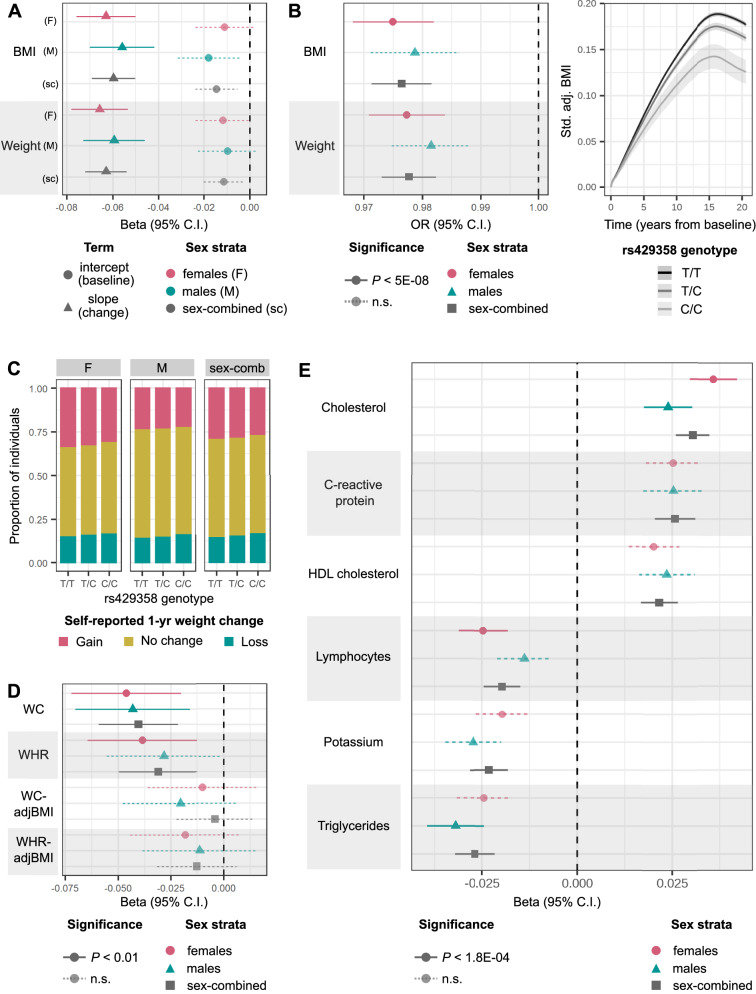
Fig. 3. Association of minor C allele of rs429358, missense variant in APOE, with various longitudinal phenotypes.
A Mean effect size (beta) and 95% CI for associations of rs429358 with BMI and weight intercepts or linear slope change over time estimated from GWAS in all analysis strata (BMI N = 87,908 females and 73,656 males; weight N = 96,264 females and 80,144 males). B Left: mean OR and 95% CI estimated from GWAS for association of rs429358 with posterior probability of membership in the BMI and weight high-gain clusters (k1). BMI N = 87,908 females and 73,656 males; weight N = 96,264 females and 80,144 males. Right: modelled trajectories of standardised (std.) covariate-adjusted (adj.) BMI in carriers of the different rs429358 genotypes. C Proportion of individuals who self-report weight gain, weight loss, or no change in weight over the past year for carriers of each rs429358 genotype. D Mean effect size and 95% CI for associations of rs429358 with slopes over time of waist circumference (WC) (N = 22,680 females and 21,474 males), WC adjusted for BMI (WCadjBMI) (N = 22,591 females and 21,379 males), waist-to-hip ratio (WHR) (N = 22,677 females and 21,474 males), and WHRadjBMI (N = 22,589 females and 21,379 males), estimated from linear mixed-effects models in individuals held-out of discovery analyses (see Supplementary Data 6 for effect estimates and P values). E Mean effect size and 95% CI for associations of rs429358 with linear slope change in quantitative biomarkers over time, estimated from linear mixed-effects models (N between 52,462–146,098 for different biomarkers, see Supplementary Data 8 for details). Across all panels, estimates of trait change are adjusted for baseline trait values, and P values for significance are controlled at 5% across number of tests performed via the Bonferroni method. n.s. non-significant.

