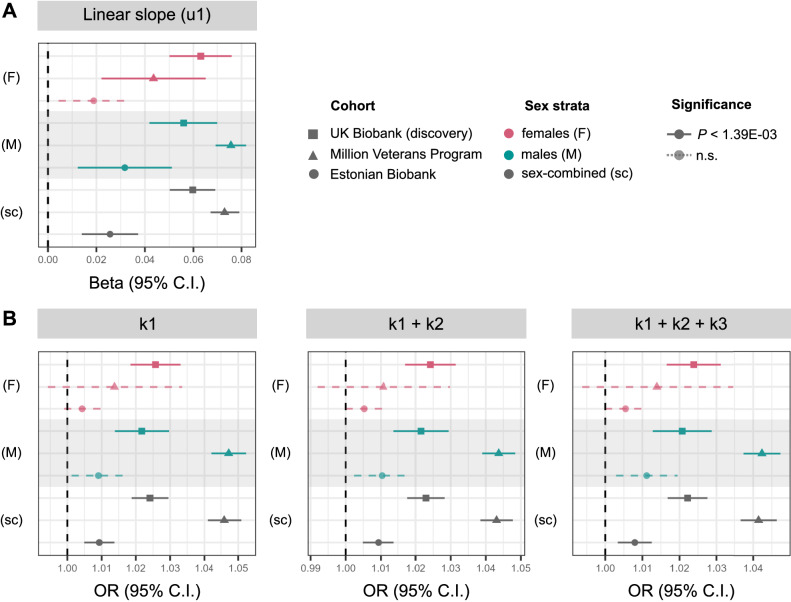
Fig. 4. Effect sizes of rs429358 on BMI-change phenotypes in discovery (UK Biobank (UKBB)) and replication (Million Veterans Program (MVP) and Estonian Biobank (EstBB)) datasets.
A Mean effect size (beta) and 95% CI for associations of rs429358 with BMI linear slope change over time estimated from linear mixed-effects models (u1) GWAS in all analysis strata (see Supplementary Data 5 for effect estimates and P values). B Mean OR and 95% CI for association of all obesity-change lead variants with posterior probability of membership in the BMI high-gain cluster (k1), high or moderate gain clusters (k1 + k2), or all but loss clusters (k1 + k2 + k3). Across all panels, UKBB N = 162,208, MVP N = 437,703, EstBB N = 127,760; see Supplementary Data 23 for sex-stratified sample sizes. All estimates of trait change are adjusted for baseline trait values, and P values for significance are controlled at 5% across number of tests performed via the Bonferroni method. n.s. non-significant.

