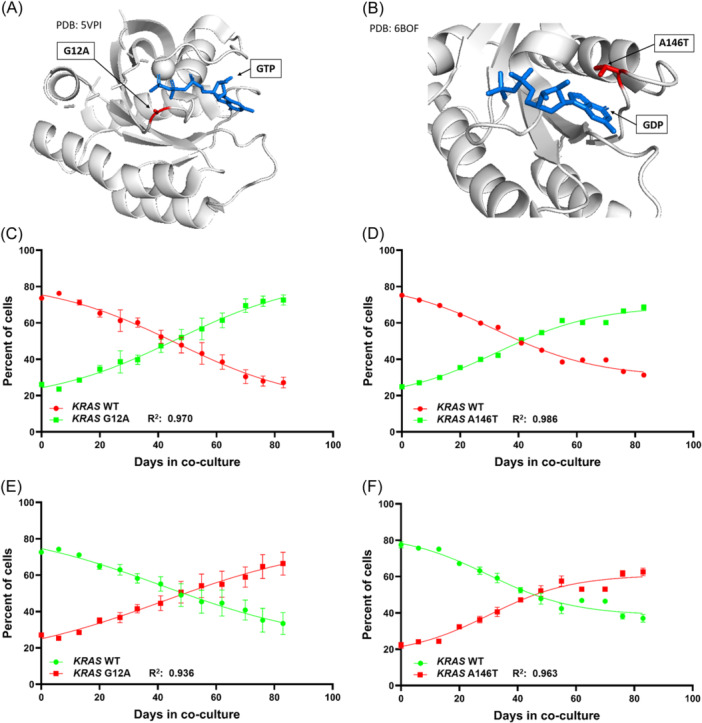
Figure 2.

Clonal competition assays of OPM2 sublines bearing KRAS mutations G12A or A146T compared to OPM2 KRAS WT cells. (A) Structural representation of the oncogenic KRAS mutation G12A (PDB: 5VPI, 42 ) in complex with GTP and the magnesium ion cofactor. (B) KRAS A146T mutation in complex with GDP (PBD: 6BOF, 40 ), there is no magnesium ion coordination in this structure. The mutated residues are represented in red. GTP and GDP are displayed in blue; for clarity no different colors indicating charges are assigned to any atom. Clonal Competition Assays reveal a gradual increase of the mutants KRAS G12A (C, E) and KRAS A146T (D, F) outcompeting the OPM2 KRAS WT cells due to enhanced fitness. This effect was confirmed by technical replicates and by switching the color coding between WT and mutant cells. The error bars indicate the two‐paired 95% CI.
