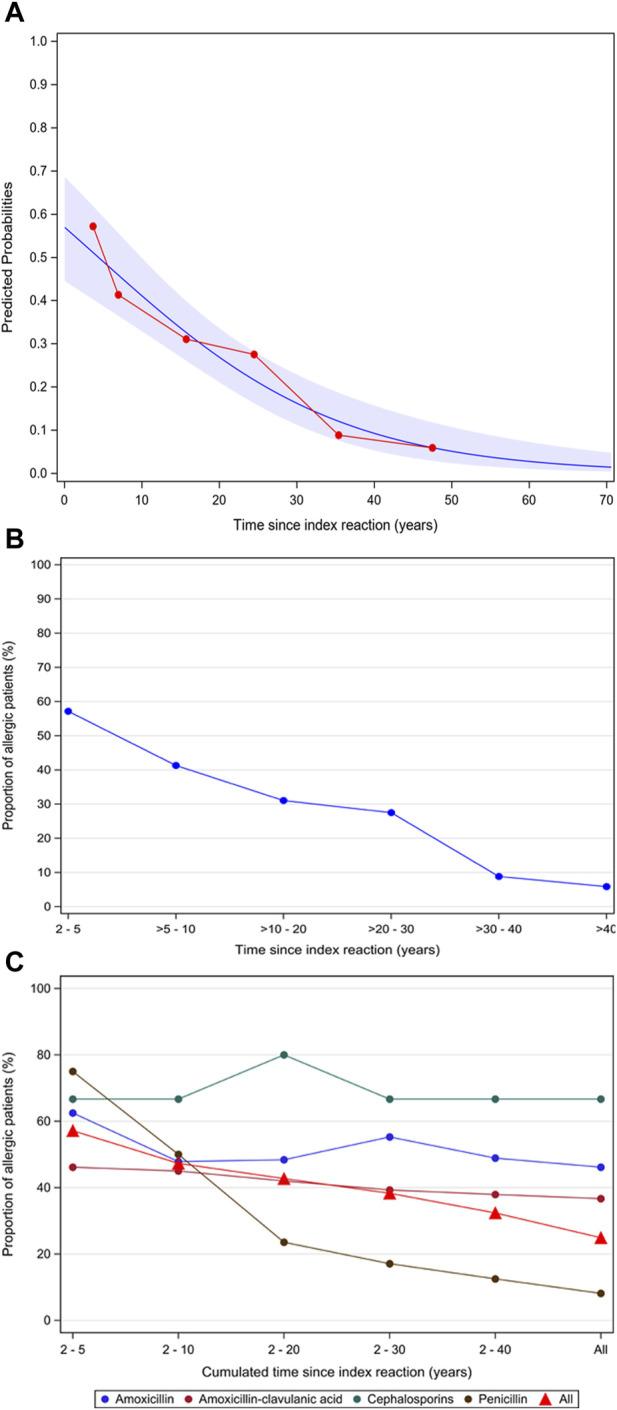
FIGURE 4.

(A) Predicted probability of being diagnosed as allergic according to the time passed since the index reaction. (B) Reduction in the proportion of allergic patients according to the time passed since the index reaction. (C) Reduction in the proportion of allergic patients according to the culprit drug since the index reaction. Figure 4A: In blue, the probability predicted by the logistic regression model, which estimates the OR of 0.56, is represented, with the 95% confidence bands; in red, the observed values.
