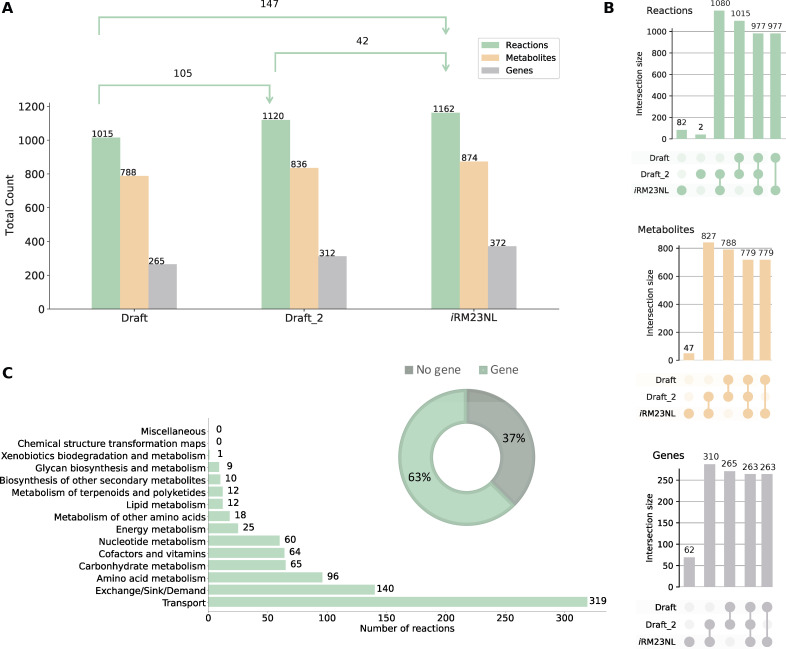
Fig 2.
Properties of the genome-scale metabolic model for R. mucilaginosa DSM20746, iRM23NL. (A) Evolution of metabolic network content from its initial draft to the final stage of extensive manual gap-filling. The shifts in the sets’ sizes are also displayed in each stage. The first stage of gap-filling is denoted by Draft_2, while the final stage is upon validation with experimental data. (B) UpSet plots comparing sets between three model versions created using the UpSetPlot package (29). The numbers indicate the cardinality of the respective set. (C) Subsystem-level statistics within pathways along with the distribution of gene- and non-gene-associated reactions. The pathway analysis was limited to reaction identifiers that could be successfully mapped to Kyoto Encyclopedia of Genes and Genomes (KEGG) (30) reactions.

