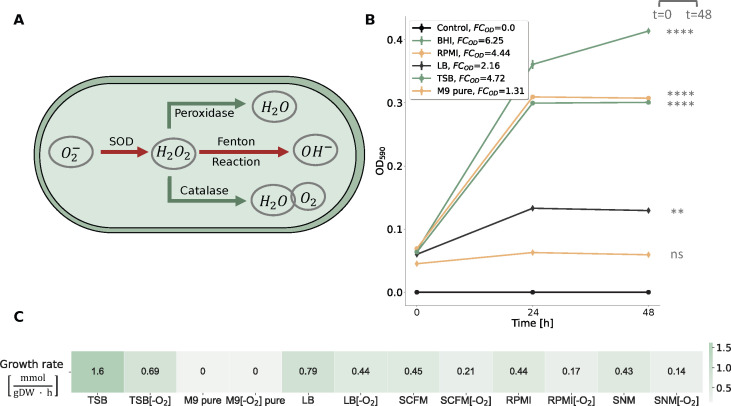
Fig 4.
Investigation of R. mucilaginosa’s growth behavior in different nutrient media. (A) Metabolic response of R. mucilaginosa under anaerobic stress as represented in iRM23NL. Reduction process of oxygen (O2−) generating ROS is indicated by red arrows, while pathways highlighted in green arrows represent reactions governed by ROS scavenging enzymes leading to bacterial cell detoxification. (B) Experimentally-derived growth curves for R. mucilaginosa DSM20746 in multiple liquid growth media along with the respective fold changes (FCs) of the acquired optical densities (ODs) at 590 nm, as defined in Equation 1. The data shown here are an average of three biological replicates (n = 3). Based on the experimental results, a threshold of FCOD = 1.4 was established to qualitatively describe bacterial growth. We verified the correctness of the threshold by performing statistical analysis as described in Materials and Methods. All data are normally distributed, while there is no significant difference between their variances. The asterisks flag the significance levels. The BHI medium was used as a baseline, while the Control line represents blank measurements of pure media. Bacterial growth was aerobically measured by the OD at 590 nm (ordinate) at three distinct time points ranging from 0 h to 48 h (abscissa). (C) In silico-simulated growth rates using iRM23NL. Detailed in silico media formulations are provided in Table S2.

