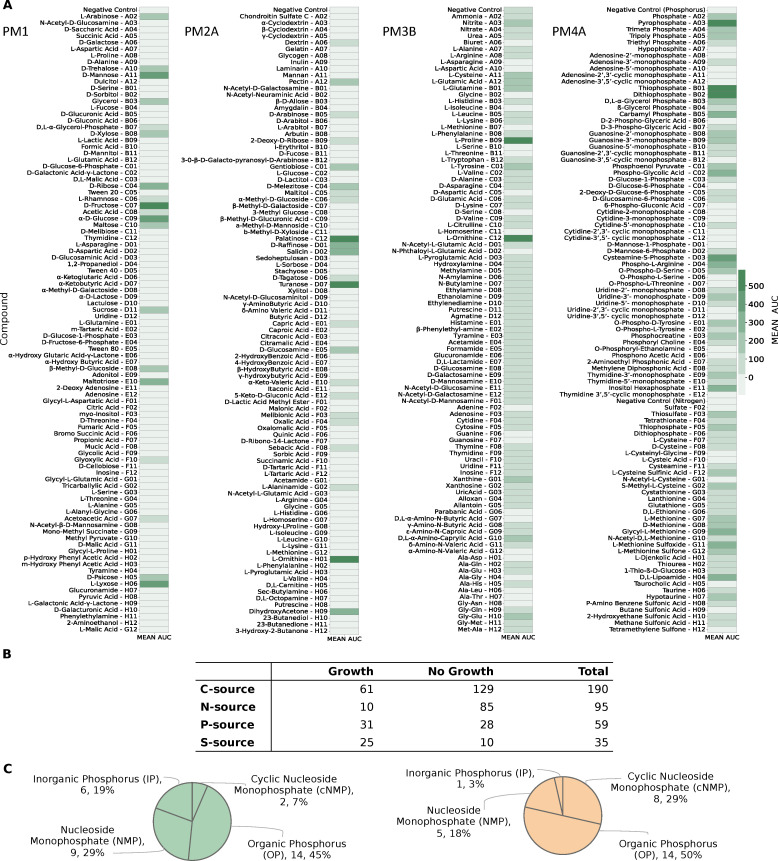
Fig 5.
Complete experimentally-derived nutrient utilization phenome of R. mucilaginosa DSM20746. (A) Utilization of individual nutrients by the bacterium across four Biolog phenotypic microarrays. Bacterial growth was measured by OD at 590 nm. (B) Numerical summary nutrient sources experimentally tested in each Biolog phenotype microarray (PM), classified into those resulting in bacterial growth and those that R. mucilaginosa could not utilize. (C) Categorization of all tested phosphorous sources during the high-throughput Biolog assay. Utilization of totally 31 phosphorus sources resulted in positive phenotype (green chart), while the cell exhibited an inability to utilize the remaining 28 (orange chart).

