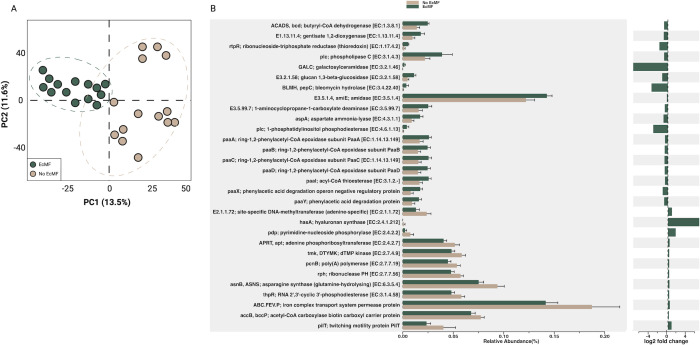
Fig 2.
PICRUSt2 analysis of soil bacterial communities in the presence or absence of EcMF. (A) Principal component analysis demonstrating the functional differences between bacterial communities based on treatment. Ellipses indicate confidence intervals of 95%. (B) The top 30 KEGG features that were differentially abundant between treatments according to DESeq2 (P < 0.05; P-adjusted using the Holm-Bonferroni method). Error bars indicate confidence intervals of 95%. The relative log2 fold changes are provided adjacent to the relative abundance of the top 30 gene products, and EC numbers are listed alongside their corresponding gene product name. See Tables S1 and S2 for a comprehensive list of the KO features and EC numbers detected in our analyses.

