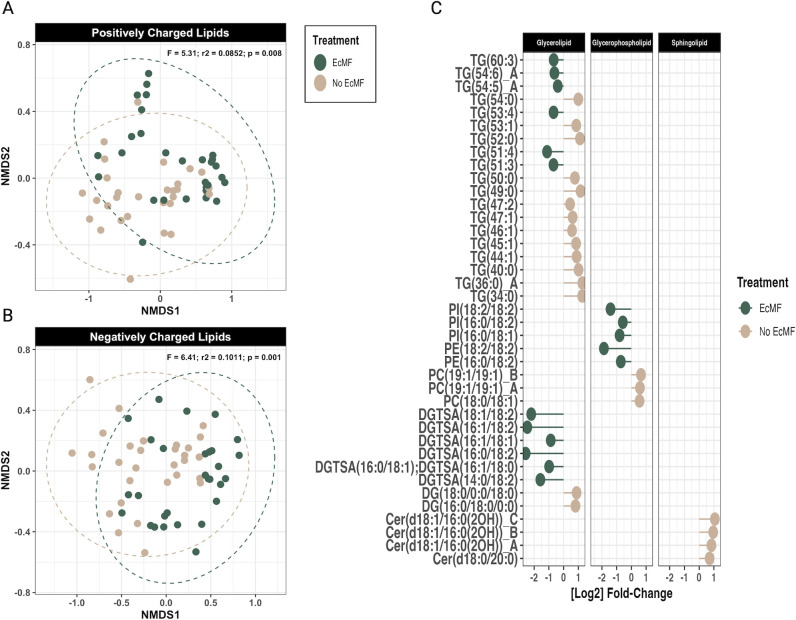
Fig 4.
Soil lipid comparison between soils with and without EcMF. (A) NMDS ordination plot of the positively charged lipids and (B) negatively charged lipids. Soils with EcMF are colored green, and soils without EcMF are colored tan. PERMANOVA results are shown in the upper right corner of the NMDS figure panels. (C) DESeq2 analysis of the lipids that are enriched in the presence of EcMF (left of the zero on the x-axis) and in the absence of EcMF (right of the zero on the x-axis). All lipids shown have a P-adjusted value (Benjamini-Hochberg) equal to or less than 0.05. The lipid species designations are as follows: Cer, ceramide; HexCer, hexosylceramide; PC, phosphatidylcholine; PC-Lyso, lyso-phosphatidylcholine; PE, phosphatidylethanolamine; PG, phosphatidylglycerol; PI, phosphatidylinositol; DGDG, digalactosyldiacylglycerol; DGTSA, diacylglyceryltrimethylhomo-serine; SQDG, sulfoquinovosyl diacylglycerol; DG, diacylglycerol; and TG, triacylglycerol.

