Fig 6.
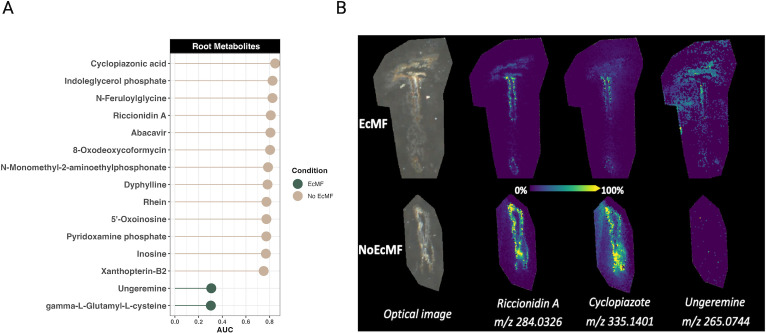
MALDI-FTICR detected root metabolites. Metabolites that were significantly enriched in plant roots that either were colonized by EcMF (green) or were not colonized by EcMF (tan) are shown. (A) Area under the curve values represent how enriched metabolites were between conditions (i.e., EcMF versus No EcMF). The ions detected for all the metabolites listed represent a single metabolite according to the KEGG database. (B) MALDI ion root images comparing the localization and intensity of selected metabolites between treatments. Note that all annotations are confirmed only by MS1 at the exact molecular formula level. For a comprehensive list of all the ions and their potential metabolite annotations, see Tables S4 and S5.

