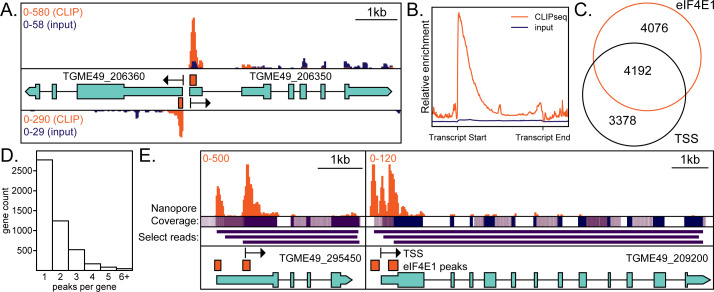
Fig 3.
eIF4E1HA associates with the 5′ end of mRNAs. (A) An example of a bidirectional promoter demonstrates the specificity of interaction between eIF4E1HA and m7G-capped mRNAs. Sequencing tracks from size-matched input samples (input) are shown for reference. The scale in the top left side of the panel indicates the relative abundance of CLIPseq (orange) and input reads (blue). Black arrows indicate annotated transcriptional start sites (TSS) as determined by RAMPAGEseq (23). Orange bars are regions statistically enriched by eIF4E1HA CLIPseq. Relevant gene accession numbers are indicated. (B) A metagene plot demonstrating CLIPseq enrichment over input and that eIF4E1HA is associated with the TSS. (C) Analysis of the proximity (within 20 nt) of eIF4E1HA-enriched sites to annotated TSSs. (D) Analysis of the number of eIF4E1HA-enriched regions per gene. (W) Two examples of alternate TSS usage. eIF4E1HA-enriched regions are supported by nanopore reads as evidenced by coverage and select individual read tracks, displayed in purple (24). The scale in the top left side of the panel indicates the relative abundance of CLIPseq reads (orange). Relevant gene accession numbers are indicated.

