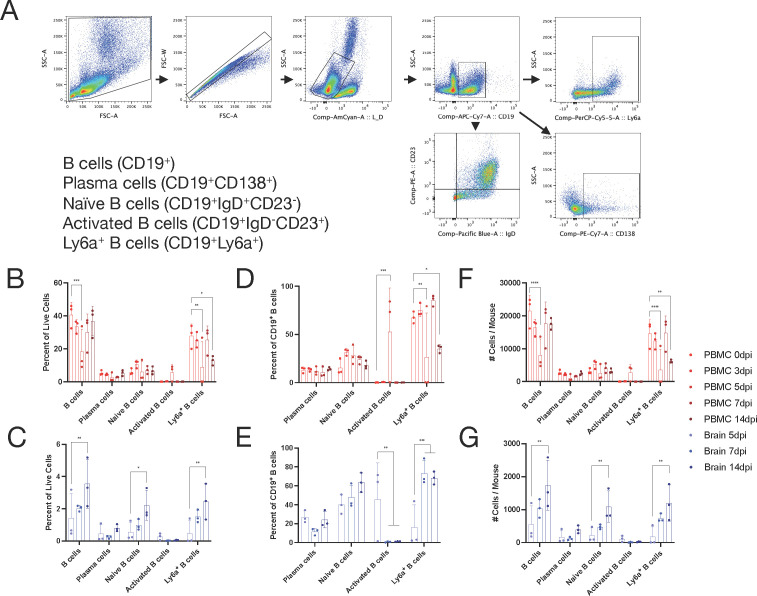
Fig 4.
B cell population dynamics in the blood and brain. (A) B cell gating scheme for analysis. (B–G) Identification by flow cytometry of B cells in circulating blood (red) or brain (blue) over the course of infection at 0, 3, 5, 7, and 14 dpi (blood) or 5, 7, and 14 dpi (brain). The subpopulations are presented as either a percentage of all live cells (B and C), a percentage of CD19+ B cells (D and E), or the total number of cells per mouse (F and G) with the mean ± SD from three independent experiments with the cells pooled from four to seven mice. No indicator, non-significant, *P < 0.05, **P < 0.01, ***P < 0.001, and ****P < 0.0001; Dunnett’s multiple comparisons test.

