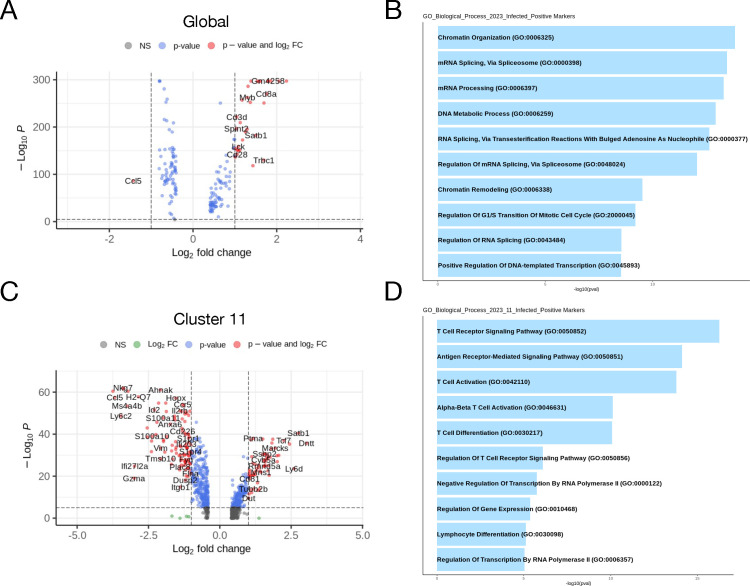
Fig 5.
Transcriptomic signature of circulating immune cells during viral encephalitis. (A and C) Volcano plots representing differentially expressed genes between control and infected mice globally (A) or within cluster 11 (C). Results were calculated using the FindMarkers function in Seurat specifying the Wilcoxon rank-sum test with genes detected in 25% of cells and at least 1.5-log-fold change between groups. (B and D) Pathway visualization bar plot of differentially expressed genes using the GO biological process database.

