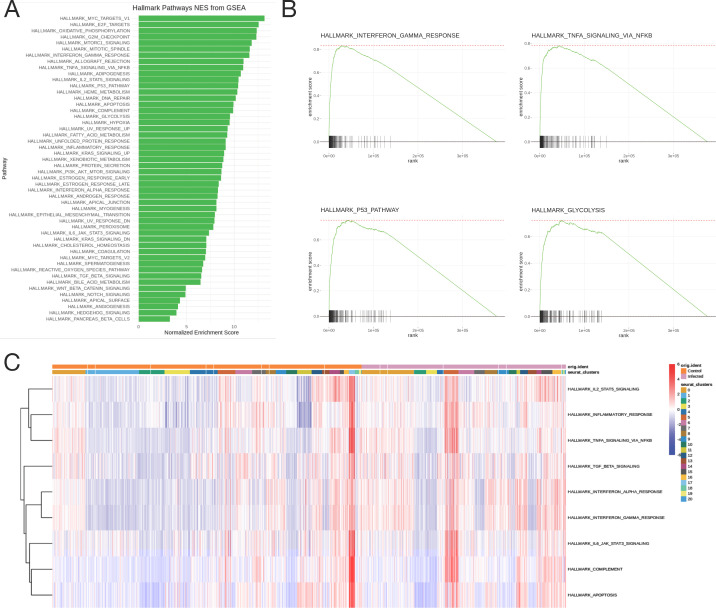
Fig 6.
Gene set enrichment analysis. (A) Normalized enrichment scores from GSEA of the 50 hallmark gene sets from the MSigDB. (B) Enrichment plots for key immune pathways—IFNγ pathway (top left), TNFα pathway via NF-κB (top right), p53 pathway (bottom left), and glycolysis pathway (bottom right). The black lines represent the position of genes in each pathway in a ranked list of differentially expressed genes, and the area under the curve represents the total enrichment of response genes. (C) Heatmap showing enrichment scores of hallmark immune pathways in individual cells striated by cluster and infection status.

