Fig 2.
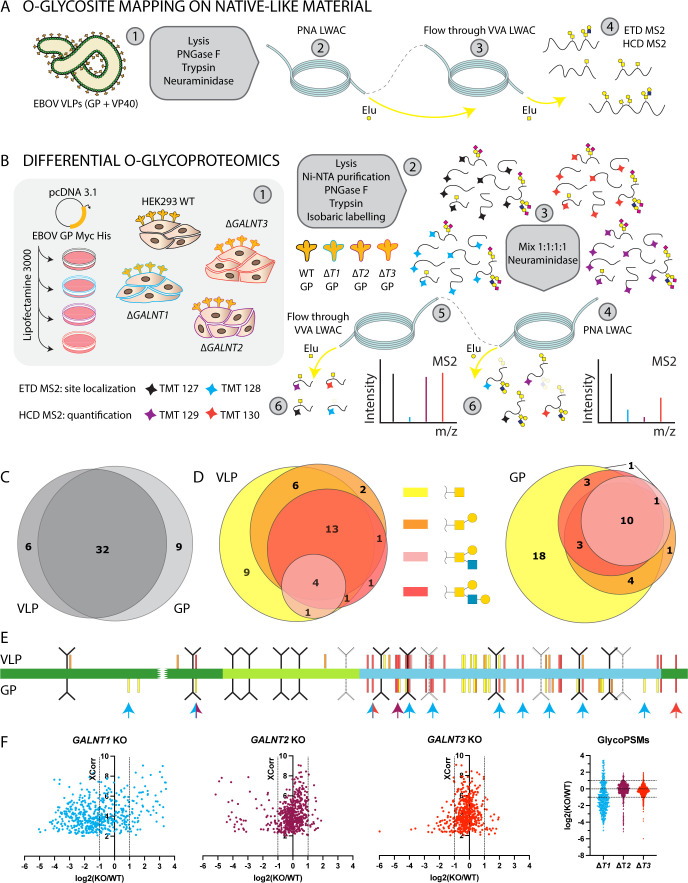
Ebola virus GP O-glycoproteomics. (A) Approach for mapping O-glycosites on Ebola virus-like particles comprised of GP and VP40 proteins. (B) Approach for mapping differentially glycosylated O-glycosites on full-length recombinant GP expressed in GALNT KO cell lines. (C) Overlap between VLP- and GP-identified O-glycosites. (D) The Venn diagrams were generated using DeepVenn (51) and depict the heterogeneity of identified site-specific structures, plotted separately for VLP (left) and GP (right). (E) Identified O-glycosites were mapped onto GP1 layout and colored based on the longest site-specific structure identified (color code as in D). GalNAc-T1, -T2, and -T3-regulated sites are indicated with cyan, maroon, and red arrows, respectively. (F) The dot plots depict distribution of TMT quantification ratios compared with wild type (log₂) for glycopeptide PSMs (peptide spectrum matches) identified in both PNA and VVA LWAC experiments plotted against XCorr (cross-correlation score) values.

