Fig 5.
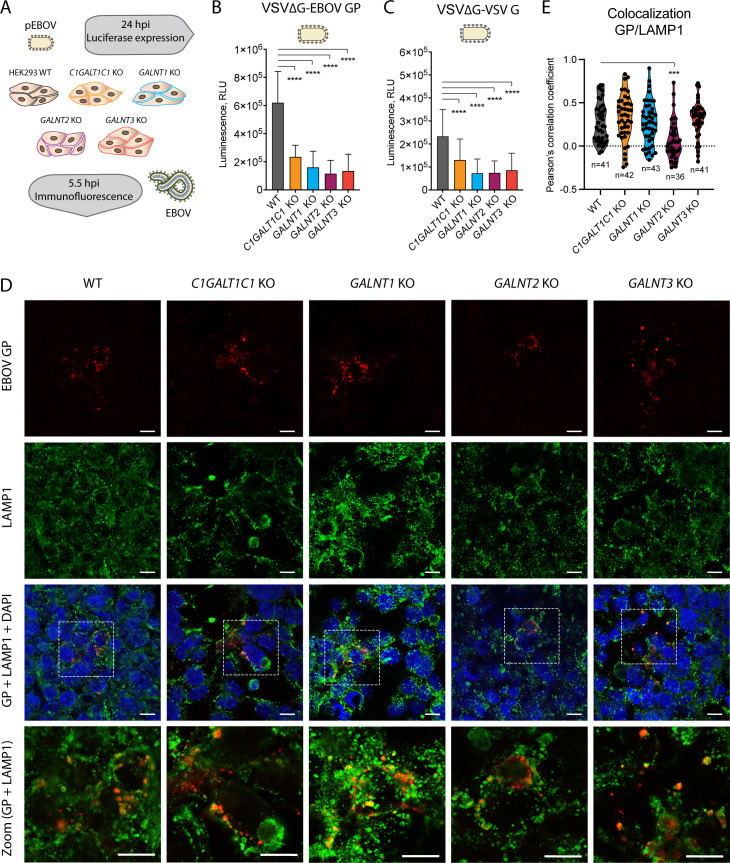
Influence of O-glycosylation on EBOV entry to cells. (A) Experimental setup for investigating the entry of pseudotyped and authentic EBOV. (B) Entry of pEBOV-VSVΔGLuc to different HEK293 KO cells shown as reporter gene expression 24 hours post-infection. The data are shown as mean + SD of five biological replicates from three independent experiments. Two-way ANOVA followed by Dunnett’s multiple comparison test was used to evaluate differences from wild type (*P < 0.05, **P < 0.01, ***P < 0.001, and **** P < 0.0001). (C) Entry of Vesicular Stomatitis Virus (VSV) G-VSVΔGLuc to different HEK293 KO cells shown as reporter gene expression 24 hours post-infection. The data are shown as mean + SD of six biological replicates from three independent experiments. Two-way ANOVA followed by Dunnett’s multiple comparison test was used to evaluate differences from wild type (*P < 0.05, **P < 0.01, ***P < 0.001, and ****P < 0.0001). (D) HEK293 knockout cell lines infected with the Makona isolate of Zaire EBOV at 0.01 multiplicity of infection (MOI) and fixed in acetone 5.5 hours post-infection were co-stained for EBOV GP (red) and lysosomal marker LAMP1 (green). White boxes indicate zoomed-in regions shown in bottom panels. (E) Up to 43 regions of interest (ROI) containing GP-positive vesicles were selected for multiple images for each cell line and colocalization estimated based on pixel-intensity correlation analysis [Pearson’s correlation coefficient (PCC)]. The violin diagrams depict the distributions of the calculated PCCs for the sampled ROIs. One-way ANOVA followed by Dunnett’s multiple comparison test was used to evaluate the differences of mean PCCs compared with wild type (*P < 0.05, **P < 0.01, ***P < 0.001, and ****P < 0.0001).

