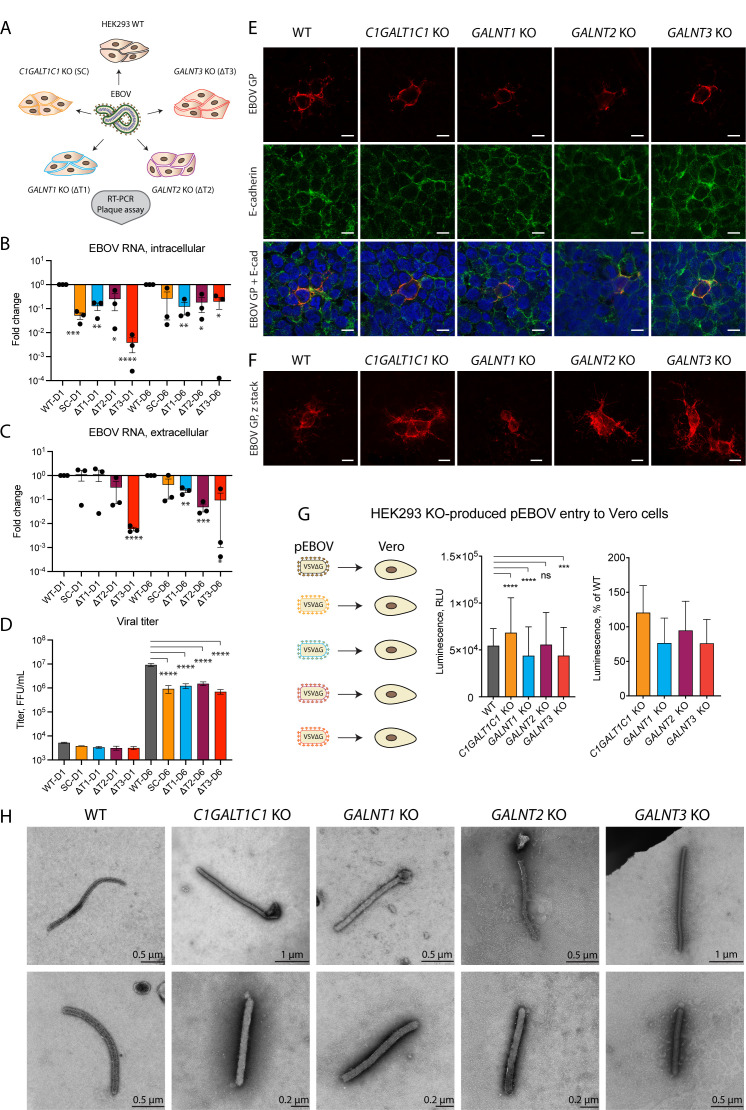
Fig 6.
Influence of GalNAc-Ts on EBOV replication. (A) Experimental strategy for addressing the functional role of O-glycosylation in EBOV biology. (B, C) Quantitative reverse transcription PCR (RT-qPCR) analysis of viral RNA D1 and D6 post-infection of glycoengineered HEK293 cells. Expression levels are normalized to β-actin and presented as fold change compared with wild type. Data are shown as mean ± SEM of three independent experiments, where individual datapoints are also shown. One sample t-test was used to evaluate differences from 1 (*P < 0.05, **P < 0.01, ***P < 0.001, and ****P < 0.0001). (B) Intracellular RNA. (C) Extracellular RNA. (D) Plaque titration analysis of Ebola virus in cell culture supernatants of infected glycoengineered cells on D1 and D6 post-infection. Data are shown as mean ± SEM of two independent experiments. One-way ANOVA followed by Šidák’s multiple comparison test was used to evaluate differences in titers compared with wild type on the individual days post-infection (*P < 0.05, **P < 0.01, ***P < 0.001, and ****P < 0.0001). (E, F) HEK293 knockout cell lines infected with the Makona isolate of Zaire EBOV at 0.01 MOI and fixed in acetone 24 hours post-infection were stained for EBOV GP (red) and E-cadherin (green). (E) Confocal snapshots. Scale bar, 10 µm. (F) z-stack maximal intensity projections for EBOV GP. Scale bar, 10 µm. (G) Titers of HEK293 KO cell line-produced pEBOV-VSVΔGLuc harvested 14 hours post-infection and assayed on Vero cells by measuring reporter gene expression 24 hours post-infection. The data are shown as mean + SD of eight biological replicates from four independent experiments. Two-way ANOVA followed by Dunnett’s multiple comparison test was used to evaluate differences from wild type (*P < 0.05, **P < 0.01, ***P < 0.001, and ****P < 0.0001). (H) TEM micrographs of Ebola virions produced in the panel of glycoengineered cell lines 24 hours post-infection. Negative staining with phosphotungstic acid was used for contrasting the specimens. Scale bar is indicated on each image.

