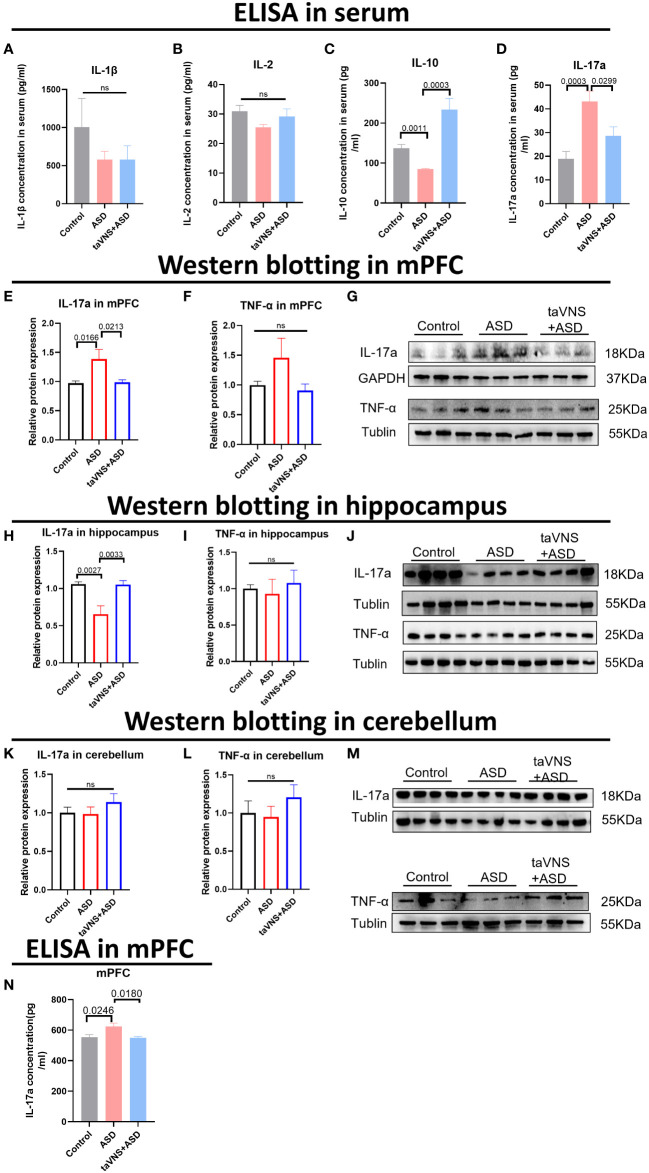
Figure 2.
TaVNS preferentially attenuated the increase in IL-17a levels in the mPFC area. (A-D) ELISA was used to detect the expression levels of IL-1β, IL-2, IL-10, and IL-17a in the serum. Statistical results showed significant changes in IL-10 and IL-17a, and no significant difference in IL-1β and IL-2 (IL-1β, n=5,7,7; IL-2, n=11,5,5; IL-10, n=11,3,5; and IL-17a, n=12,12,12). (E, F) WB detection of the relative expression levels and bands corresponding to IL-17a and TNF-α in the mPFC. Statistical results showed significant changes in IL-17a, and no significant difference in TNF-α (IL-17a, n=14, 14, and 14; TNF-α, n=7, 6, and 7). (G) Protein blotting bands for IL-17a and TNF-α in the mPFC. (H, I) WB analysis of the relative expression levels and bands corresponding to IL-17a and TNF-α in the hippocampus. Statistical results showed significant changes in IL-17a, and no significant difference in TNF-α (8 IL-17a-treated mice per group and 7 TNF-α-treated mice per group). (J) Protein blotting bands for IL-17a and TNF-α in the hippocampus. (K, L) WB analysis of the relative expression levels and bands corresponding to IL-17a and TNF-α in the cerebellar region. Statistical results showed no significant change in IL-17a and TNF-α (8 IL-17a-treated mice per group and 7 TNF-α-treated mice per group). (M) Protein blotting bands for IL-17a and TNF-α in the cerebellar region. (N) ELISA detection of IL-17a levels in the mPFC. Statistical results showed significant changes in IL-17a (n=5 in control group, ASD group, and taVNS group).

