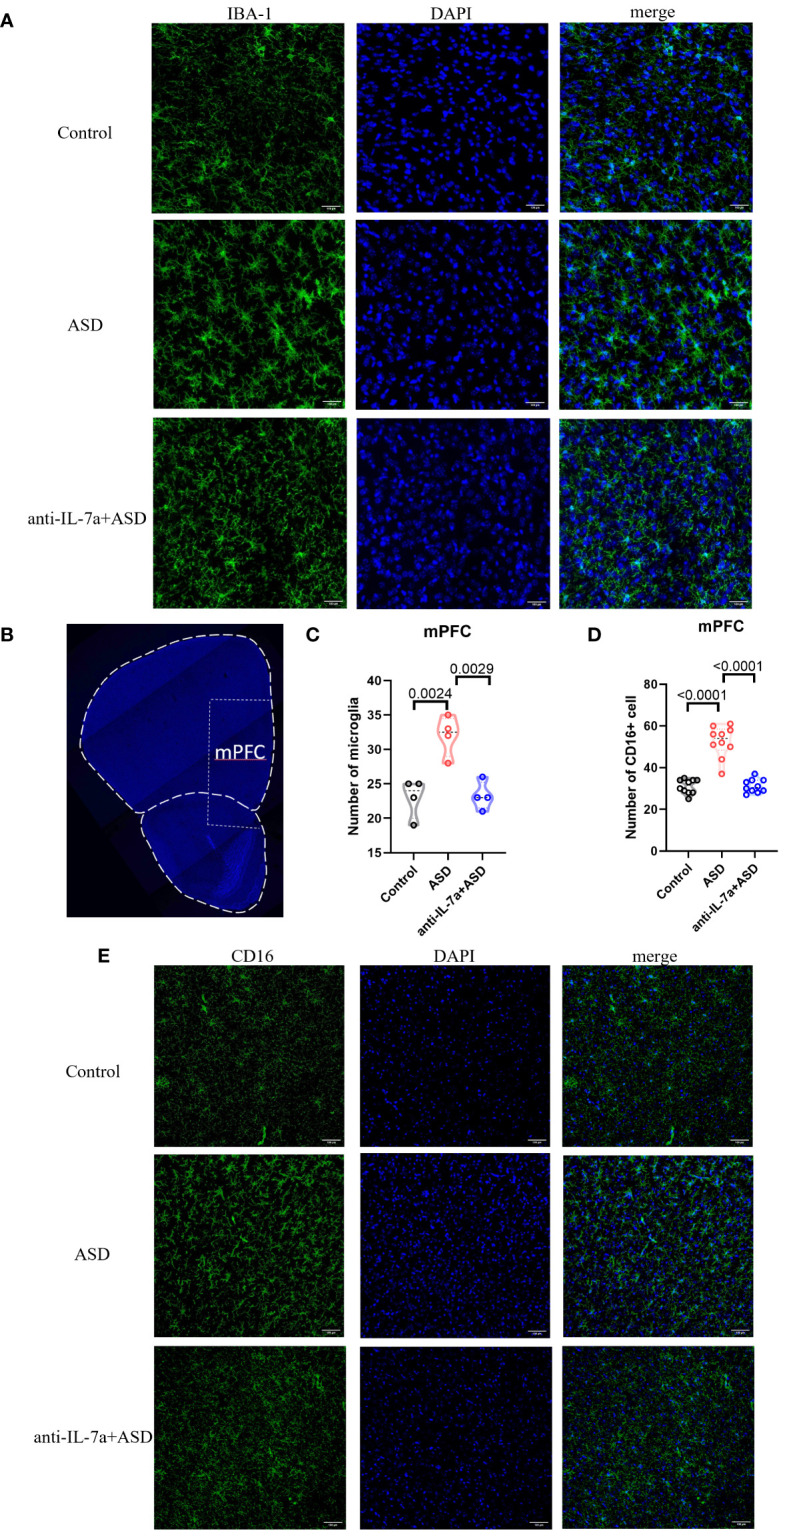
Figure 3.

TaVNS intervention reduces the number of microglia and M1 polarization. (A) Immunofluorescence staining of IBA-1 and DAPI in the prefrontal cortex (scale bars, 100 μm). (B) Coronal section displaying the mPFC (scale bars, 30 μm). (C) Count of IBA-1+ cells in the mPFC. Statistical results showed significant changes in IBA-1+ cells (n=4 in each group). (D) The number of CD16+ cells in the mPFC. Statistical results showed significant changes in CD16+ cells (n=10 in each group). (E) Immunofluorescence staining of CD16 and DAPI in the prefrontal cortex (scale bars, 100 μm).
