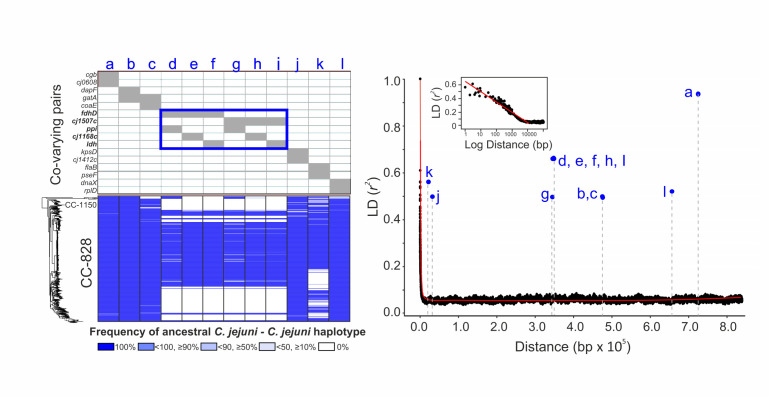
Fig 3.
Putative epistatic SNP pairs in introgressed C. coli genomes where the major haplotype was C. jejuni, indicating that both co-varying sites had C. jejuni ancestry. (Left) A total of 16 gene pairs in which the C. jejuni-C. jejuni haplotype is dominant (a to l), and frequency of ancestral C. jejuni-C. jejuni haplotype among the epistatic SNP pairs in co-varying genes is shown as the 5 categories for each C. coli strain mapped to the phylogeny (ML tree). Shades of blue indicate the % of the epistatic SNPs in the co-varying gene with ancestral C. jejuni-C. jejuni haplotype. (Right) Linkage disequilibrium (r2) decay across the C. coli CVM29710 reference genome calculated by comparison of 690 C. coli isolate genomes (ST-828 and ST-1150, Data S4). LD is determined between SNP pairs, and average LD is shown for 100 bp blocks (black dots). A red trendline plots average LD. The inset is the same data plotted on a log scale, showing that LD remains approximately constant after 5 kbp. The position of 12 co-varying C. jejuni-C. jejuni SNP pairs (blue dots) is plotted (a to l).

