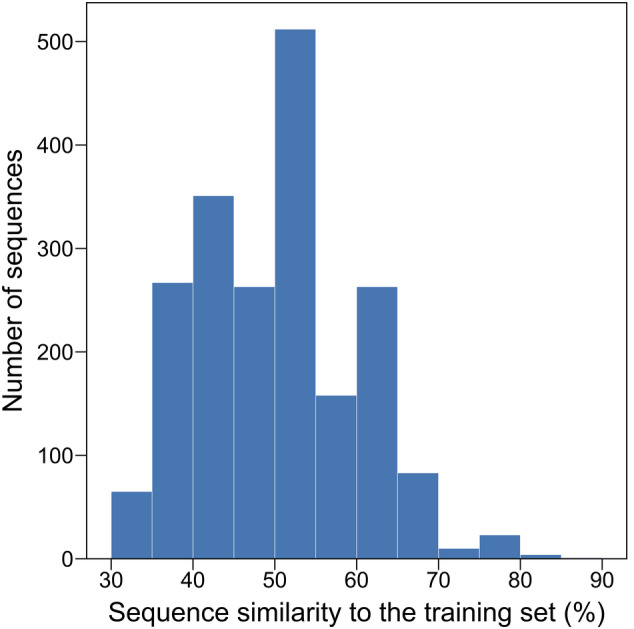
FIGURE 3.

Sequence similarity distribution of the AMPd‐Up‐generated sequences to the training set. The sequence similarity distribution, with a mean of 49.97% and a standard deviation of 9.83%, was calculated based on the 2000 sequences generated by AMPd‐Up. The sequence similarity of each generated sequence to the training set was considered as the similarity of that sequence to its most similar sequence in the training set, based on which the distribution was plotted.
