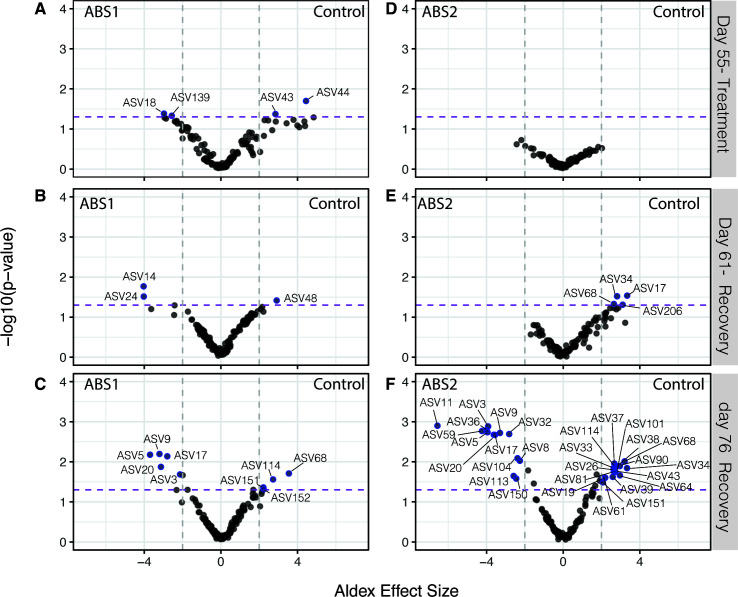
Fig 5.
Exposure to antibiotics results in differential abundance of select ASVs one and two weeks after recovery. Volcano plot of all ASVs shows differentially abundant taxa (BH adjusted Welch’s t test P < 0.05) between (A–C) ABS1 and control groups and (D–F) ABS2 and control groups (A and F) directly following ABS treatment (day 55), (B and E) one week post-ABS treatment (day 61) and (C and F) three week (day 76) post-ABS treatment. Taxa that are significantly different between treatment groups (BH adjusted P < 0.05) and a calculated ALDEx effect size >2 or <−2 are represented by blue points and labeled with the ASV number. The purple dashed line represents a BH adjusted, Welch’s t test P < 0.05. The gray dotted lines are the threshold for the ALDEx effect size >2 or <−2. ASVs that are enriched in the ABS treatments are plotted on the left side of the graph, while ASVs enriched in the control are plotted on the right.

