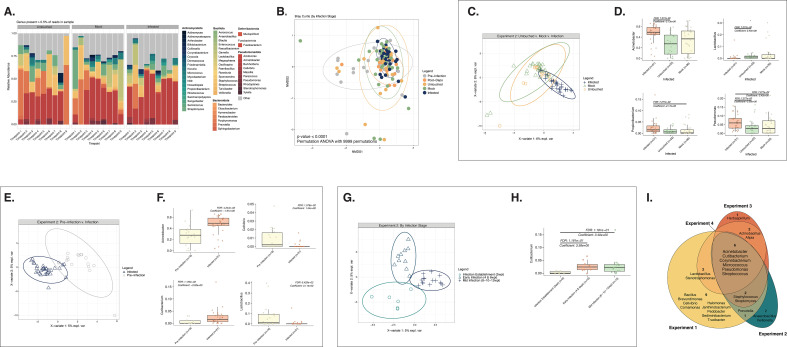
Fig 2.
MmuPV1 infection shapes host cervicovaginal microbial community composition. All plots in this figure except part 2I represent mice from Experiment 2. (A) Relative abundance of microbial genera present in at least 0.5% of the cervicovaginal microbial community for untreated, mock-infected, and MmuPV1-infected mice. Each bar represents the average relative abundance for mice within each group at each timepoint. Timepoints range from pre-intervention (Timepoints 1 and 2; the “natural community”), 1 week post-Depo-Provera (Timepoint 3), and 2–12 weeks post-infection (wpi) (Timepoints 4–9). (B) Bray-Curtis beta diversity ordination of cervicovaginal microbial community composition grouped by pre-infection, post-depo, and the untouched, mock infected, and infected groups at post-infection timepoints. PERMANOVA analysis was performed to determine significant differences among groups (P-value < 0.0001). (C) Supervised PLS-DA ordination distinguishing cervicovaginal microbial communities from untouched, mock-infected, and MmuPV1-infected mice. A corresponding vector plot indicating key microbial genera that help distinguish each of the groups in the supervised ordination is shown in Fig. S2A. (D) MAASLIN2 plots indicating genera significantly more or less abundant in MmuPV1-infected mice compared to mock-infected and/or untouched mice from Experiment 2 (Fig. 2). Note, no significant differences were observed between the mock-infected and untouched mice via MAASLIN2. (E) Supervised PLS-DA ordination distinguishing samples from pre-infection or post-infection cervicovaginal microbiomes. A corresponding vector plot indicating key microbial genera that help distinguish each of the groups in the supervised ordination is shown in Fig. S2B. (F) Genera significantly more or less abundant before (pre-infection; Timepoints 1–3) or after MmuPV1 infection (Timepoints 4–9) via MAASLIN2. (G) Supervised PLS-DA ordination distinguishing cervicovaginal microbial communities during infection establishment (2 wpi), early infection (4–6 wpi), and mid infection (8–10–12 wpi). The corresponding vector plot, indicating key microbial genera that help distinguish each of the groups in the supervised ordination, is shown in Fig. S2C. Similar analyses to these for the mice in Experiment 1, all of which were infected with MmuPV1, and Experiment 3, mock-infected and MmuPV1-infected mice 5–25 wpi, are displayed in Fig. S2D through H ,I–L, respectively. (H) Genera significantly more or less abundant in mouse cervicovaginal communities during infection establishment, early infection, or mid-infection via MAASLIN2. (I) Venn diagram of shared core taxa in mouse cervicovaginal microbial communities following MmuPV1 infection across Experiments 1–4 in this study. Lavages were used to sample cervicovaginal microbial communities for all experiments shown. Diagram indicates taxa present in >0.01% in at least 30% of the samples. Due to distinct differences in background cervicovaginal microbial communities, mice from each experiment were assessed separately. Additional analyses on mice from Experiment 1 and Experiment 3 (mid-late infection) are represented in Plots D–H and I–L, respectively, in Fig. S2.

