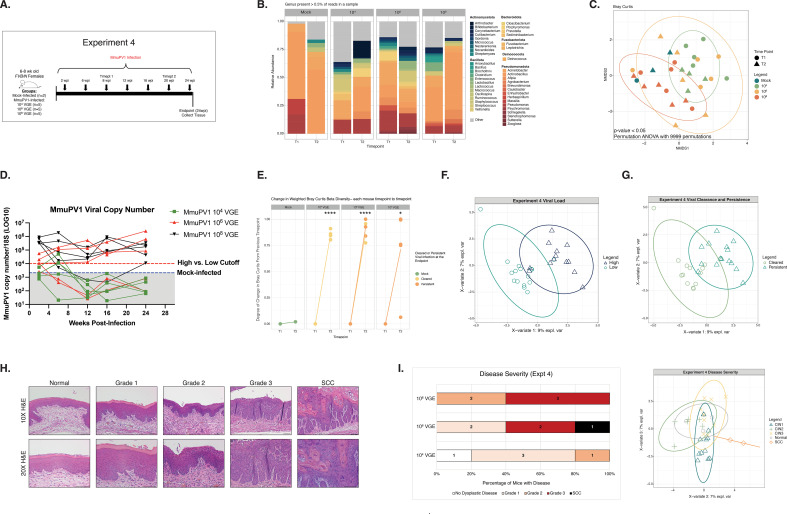
Fig 3.
MmuPV1 inoculation dose and viral persistence influences infection outcomes and cervicovaginal microbial communities. (A) A schematic detailing the main hallmarks and timepoints sampled throughout Experiment 4 in which mice were initially either mock-infected or inoculated with 104, 106, or 108 viral genome equivalents (VGE). Arrows indicate times where cervicovaginal lavages were collected for measuring MmuPV1 copy number and/or assessing cervicovaginal microbial community composition. Times labeled with “Timepoints” or “Timepts” indicate samples that were also screened by 16S sequencing. Numbers of mice per group are indicated. (B) Relative abundance of microbial genera present in at least 0.5% of mouse cervicovaginal microbial communities assessed at 8 and 20 weeks post-infection (wpi). Each bar represents the average relative abundance for mice within that group at each timepoint. (C) Bray-Curtis beta diversity ordination. Colors indicate viral inoculation group and shape indicates the timepoint of cervicovaginal microbiome samples. PERMANOVA analysis was performed to determine significant differences among groups (P-value < 0.05). (D) At multiple timepoints indicated in 3A, cervicovaginal lavages were collected, DNA extracted, and qPCR performed for the MmuPV1 E2 gene to quantify viral copy numbers. Infected mice with viral copy numbers greater than 1 × 10⁴ copies were considered to have high viral load (red line). Values detected in mock-infected mice represent background levels (2.13 × 10³; blue line). (E) Change in weighted Bray-Curtis Beta Diversity between 8 wpi (Timepoint 1; T1) and 20 wpi (Timepoint 2; T2) in mock-infected mice and mice infected with doses of 104, 106, or 108 VGE MmuPV1. Lines associated with those mice that cleared MmuPV1 infections as determined by viral load qPCR measurements (Fig. 3D) are shaded in yellow, and mice that developed persistent MmuPV1 infections are shaded in orange. (F) Supervised PLS-DA ordination plot distinguishing cervicovaginal microbial communities from mice initially inoculated with either 104 or 108 VGE that achieved either high or low viral load. A companion vector plot is shown in Fig. S3C. (G) Supervised PLS-DA distinguishing cervicovaginal microbial communities from mice who had viral persistence or clearance at the end point. A companion vector plot is shown in Fig. S3E. No significant differences were observed between mice with viral persistence or viral clearance via MAASLIN2 analysis. (H) At the conclusion of each experiment, female reproductive tract tissues were collected and H&E-stained sections used to perform histopathological analysis. Overall disease severity was scored by a trained pathologist (SMM) and worst disease reported for each tissue sample. Representative images (10× magnification, bottom; 20× magnification, top) of H&E-stained sections are shown for normal pathology, stages of progressive neoplastic disease ranging from Grade 1 to Grade 3 dysplasia, and squamous cell carcinoma (SCC). All scale bars = 100 µm. (I) Bar graph showing overall disease severity measured by histopathological analysis at the 24 wpi study endpoint of Experiment 4 for groups of mice inoculated with different doses of MmuPV1 (104, 106, or 108 VGE; left). The plot on the right shows the supervised PLS-DA ordination distinguishing cervicovaginal microbial communities from mice with no disease or hyperplasia (normal) or with various stages of cervical neoplastic disease: Grade 1/CIN1, Grade 2/CIN2, Grade 3/CIN3, or squamous cell carcinoma (SCC). For each mouse, both post-infection timepoints were included in the PLS-DA and points are colored by the cervical dysplasia score at the endpoint. Figure S3G contains the companion vector plot. No significant differences were observed between disease severity groups via MAASLIN2.

