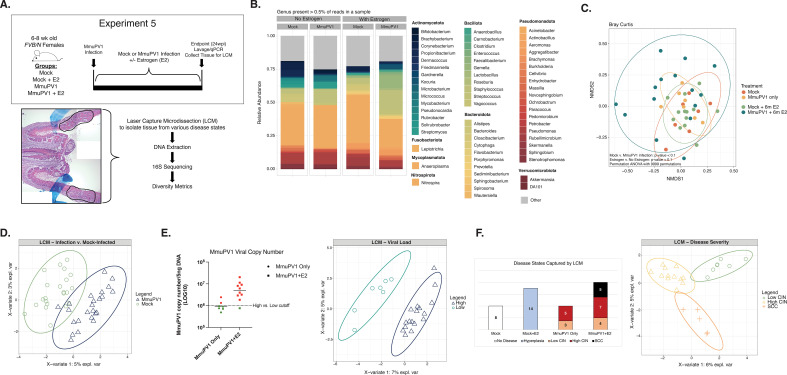
Fig 4.
Influence of MmuPV1 infection and neoplastic disease severity on the local cervicovaginal microbiome. (A) Schematic of the experimental approach to studying the local cervicovaginal microbiome in MmuPV1-infected mice across different disease states (top). At the 24 wpi endpoint, lavages were performed to measure viral load by qPCR, tissues were collected, frozen in OCT, and cryosectioned. Histopathological analysis was performed to score for neoplastic disease and to identify discrete regions of each disease state, which were marked for subsequent laser capture microdissection (LCM). A representative H&E-stained tissue section with an area of disease marked for LCM is shown (blue markings: pathology markings identifying disease), along with an overview of the LCM experiment workflow. The H&E image was generated from multiple low-magnification images that were stitched, resulting in multiple background shades present in the final image. (B) Relative abundance of microbial genera present in at least 0.5% of mouse local cervicovaginal microbial communities. Each bar represents the average relative abundance for mice within that group. (C) Bray-Curtis beta diversity ordination. Samples are colored by treatment group. (D) Supervised PLS-DA ordination separating cervicovaginal microbial communities from laser capture-microdissected regions from mock-infected versus MmuPV1-infected mice. All mice are included in this plot regardless of estrogen treatment status. The companion vector plot is displayed in Fig. S5A. (E) MmuPV1 viral copy numbers measured by qPCR from cervicovaginal lavage DNA collected at the study endpoint from mice included in the LCM experiment (left). Infected mice with viral copy numbers greater than 1 × 10⁶ copies (dotted line) were considered to have high viral load (red) compared to low viral load (green). Supervised PLS-DA ordination distinguishing local microbiomes from MmuPV1-infected mice with low versus high viral load (right). The corresponding vector plot is in Fig. S5D. (F) Overview of disease states captured by LCM by treatment group (left). Numbers represent the number of individual LCM samples per condition. Supervised PLS-DA ordination distinguishing local cervicovaginal microbiomes from MmuPV1-infected mice based on the degree of endpoint disease severity of the laser-captured tissue (low grade dysplasia/CIN, high grade dysplasia/CIN, or SCC; left). Figure S5E contains the corresponding vector plot.

