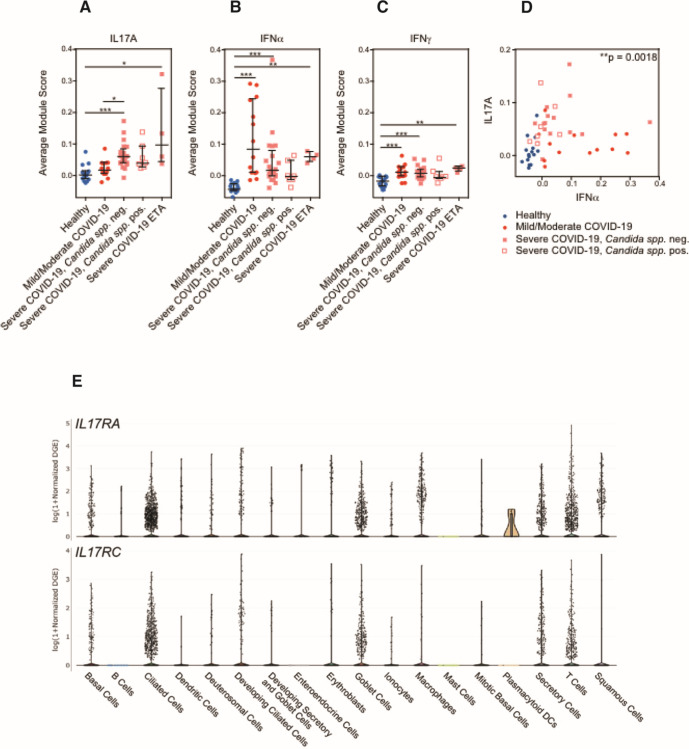
Fig 2.
Average module scores in different disease groups in all epithelial cells. (A–D) Average gene module scores calculated for each participant, separated by disease group. Module score expression was computed over all epithelial cells. Input module genes derived from in vitro stimulation with each labeled cytokine: IL17A (A), IFNα (B), and IFNγ (C). Statistical testing by Kruskal–Wallis test with Dunn’s post hoc testing. ***P < 0.001, **P < 0.01, and *P < 0.05. Lines represent the mean ± SEM. (E) Top: expression of IL17RA by cell type. Bottom: expression of IL17RC by cell type. Data accessed from https://singlecell.broadinstitute.org/single_cell/study/SCP1289.

