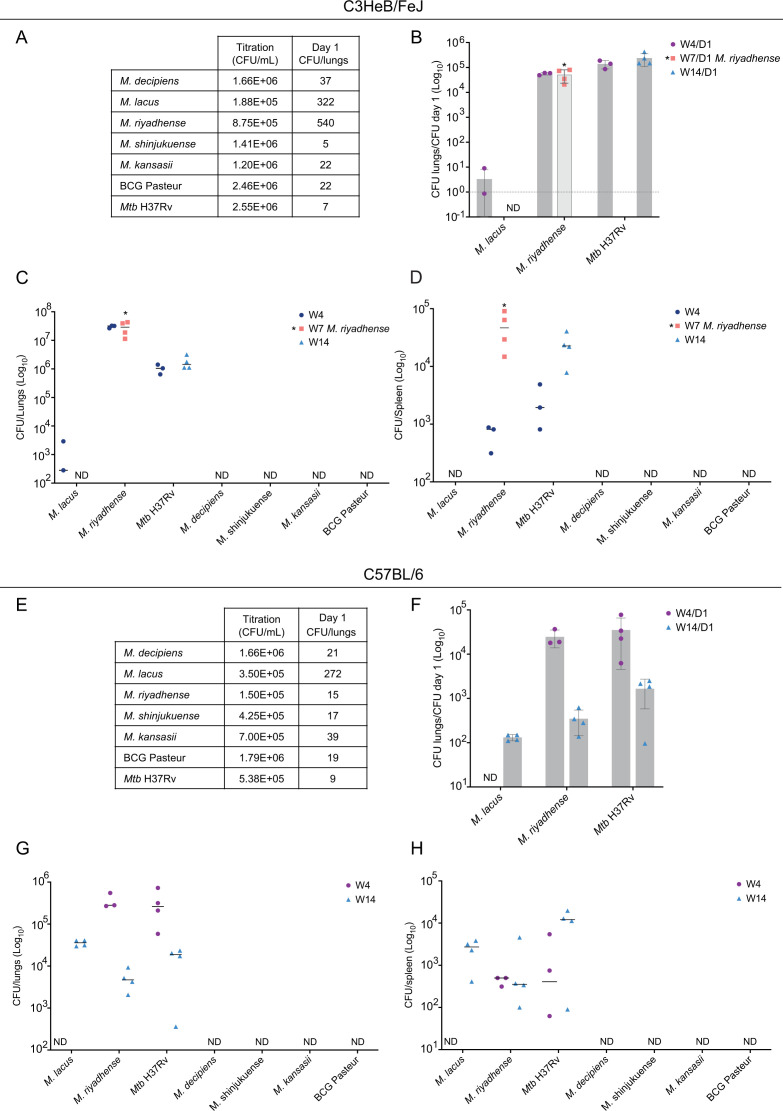
Fig 5.
Evaluation of in vivo growth capacity of M. decipiens, M. lacus, M. riyadhense, M. shinjukuense, M. kansasii, M. bovis BCG Pasteur, and Mtb H37Rv in two murine models. CFU counts in control mice at day 1 post-infection and titration of aerosolized culture of both experiments are indicated (A and E). Results from C3HeB/FeJ infection and ratios of different time points vs day 1 counts are indicated (B). Results from C3HeB/FeJ infection based on CFU counts at different time points. Results are shown at a log10 scale for lungs (C) and spleens (D). Same types of results are presented for the C57BL/6J infection with ratios of CFUs D1/CFUs titration (F), CFU counts in lungs (G) and spleens (H). Each experiment was performed once, and the represented values correspond to the number of mice at each time point. "ND": not detected.

