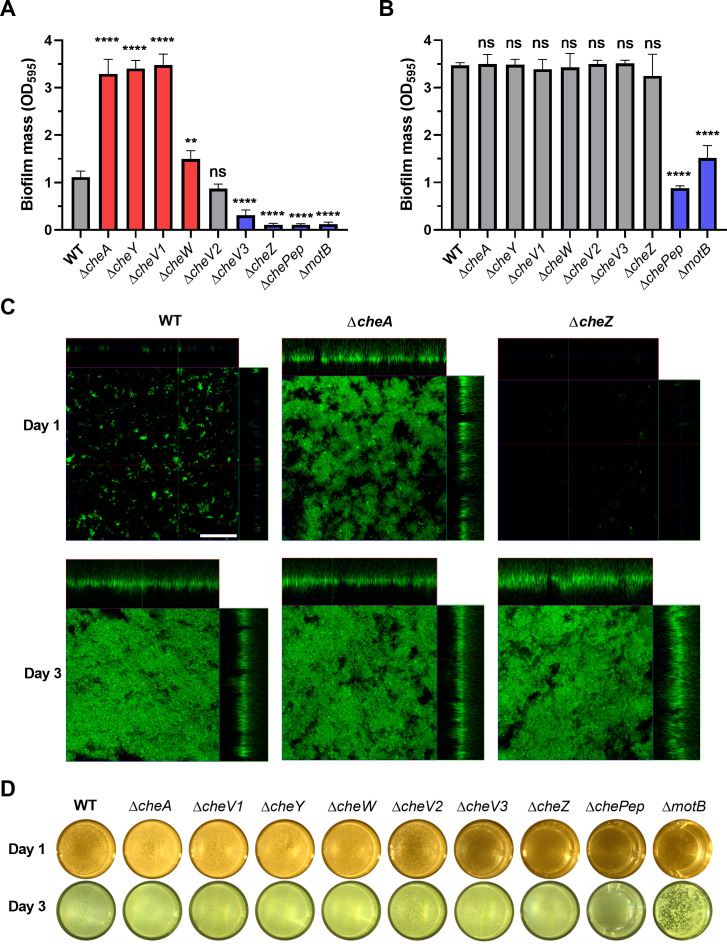
Fig 1.
Biofilm formation by H. pylori G27 wild type and chemotaxis mutants. Biofilm mass formed on microtiter plate surfaces was quantified with crystal violet at optical density 595 (OD595) after culture for 1 day (A) or 3 days (B). Mutants with significantly increased or decreased biofilm mass compared to WT are colored in red or blue, respectively. (C) Representative images of GFP-expressing WT, ΔcheA, or ΔcheZ biofilms after culturing for 1 or 3 days. The large central panel is a top view, with the side panels representing a thin section of the attached cells or microcolonies that are taken at the indicated line. Scale bars = 50 µm. (D) Representative images of pellicles formed after 1 and 3 days. The background color difference is due to lighting on different days. In all panels, values shown are the mean ± standard deviation (SD) from at least three independent experiments. Statistical analyses were performed using one-way ANOVA (****P < 0.0001; **P < 0.01), with asterisks indicating comparison to WT or NS for not significant.

