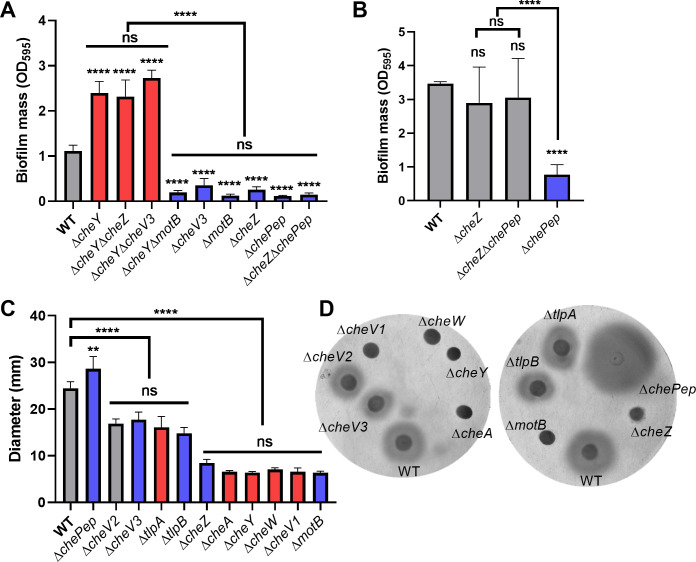
Fig 3.
H. pylori G27 biofilm initiation is dependent on the chemotaxis pathway but not correlated with chemotaxis defects. Biofilm formation of different H. pylori G27 chemotaxis double mutants after 1 or 3 days. Biofilms were formed on 96-well plates and quantified with crystal violet as in Fig. 1 and 2. (A) Biofilm formation after culturing for 1 day. (B) Biofilm formation after culturing for 3 days. (C) Soft agar migration of WT and chemotaxis mutants in 0.35% soft agar after 4 days. ΔmotB is non-motile and used as a negative control. (D) Representative soft agar images. In panels A–C, mutants showing increased or decreased biofilm mass compared to WT are colored in red and blue, respectively. Data are shown as the mean ± SDs from at least three independent experiments. Statistical analyses were performed using ANOVA (**P < 0.01; ****P < 0.0001), with asterisks indicating comparison to WT in each panel and ns indicating not significant.

