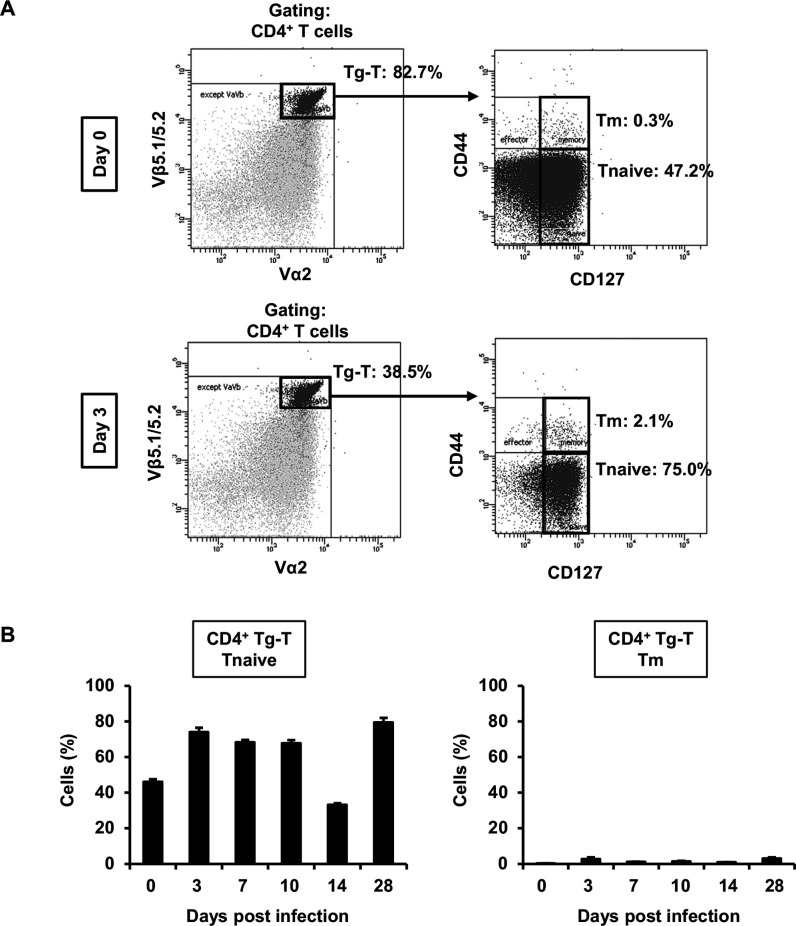
Fig 6.
Analysis of TRM and T naïve cells in the lungs of OT-II mice after C. deneoformans infection OT-II mice were infected intratracheally with C. deneoformans. (A) Pulmonary T naïve, Teff, and Tm cells in CD4+ Tg-T cells expressing OVA-specific TCR were analyzed using flow cytometry on days 0 (uninfected, n = 3) and 3 (n = 3) post-infections. Representative dot plots are shown. (B) The number of pulmonary T naïve and Tm cells in CD4+ Tg-T cells were analyzed using flow cytometry on days 0 (uninfected; n = 3), 3 (n = 3), 7 (n = 5), 14 (n = 4), and 28 (n = 6) post-infection. Each column represents the mean ± SD. Representative data demonstrating similar results from independent experiments are shown. Experiments were conducted twice for day 0, four times for day 3, twice for days 7 and 14, once for day 28, and once for day 58. The results for Fig. 6 and Fig. 7 represent experiments conducted simultaneously.

