Fig 3.
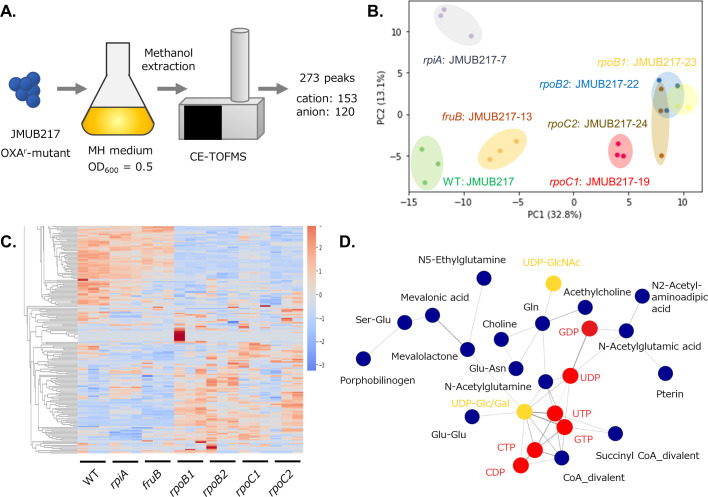
Metabolomic analysis of JMUB217-derived mutants. (A) Schematic diagram depicting the workflow of metabolomics analysis by CE-TOF-MS. (B) PCA score plot of metabolites in JMUB217-derived mutants with reduced oxacillin susceptibility: rpiA (JMUB217-7 RpiAA64E), fruB (JMUB217-13 FruBA211E), rpoB1 (JMUB217-23 RpoBH929P), rpoB2 (JMUB217-22 RpoBQ645H), rpoC1 (JMUB217-19 RpoCG950R), and rpoC2 (JMUB217-24 RpoCG498D). (C) Heat map representation of the metabolome analyzed by hierarchical clustering analysis. The distances between peaks are displayed in tree diagrams. Red and blue colors indicate higher and lower levels of metabolites, respectively. (D) Network analysis of the metabolites of JMUB217-derived mutants. Generally, metabolites are presented in blue circles, while ribonucleotides and their derivatives are highlighted in red and yellow, respectively. Figures 3 to 5 and Fig. S1 were constructed from data of the same metabolomics analysis.

