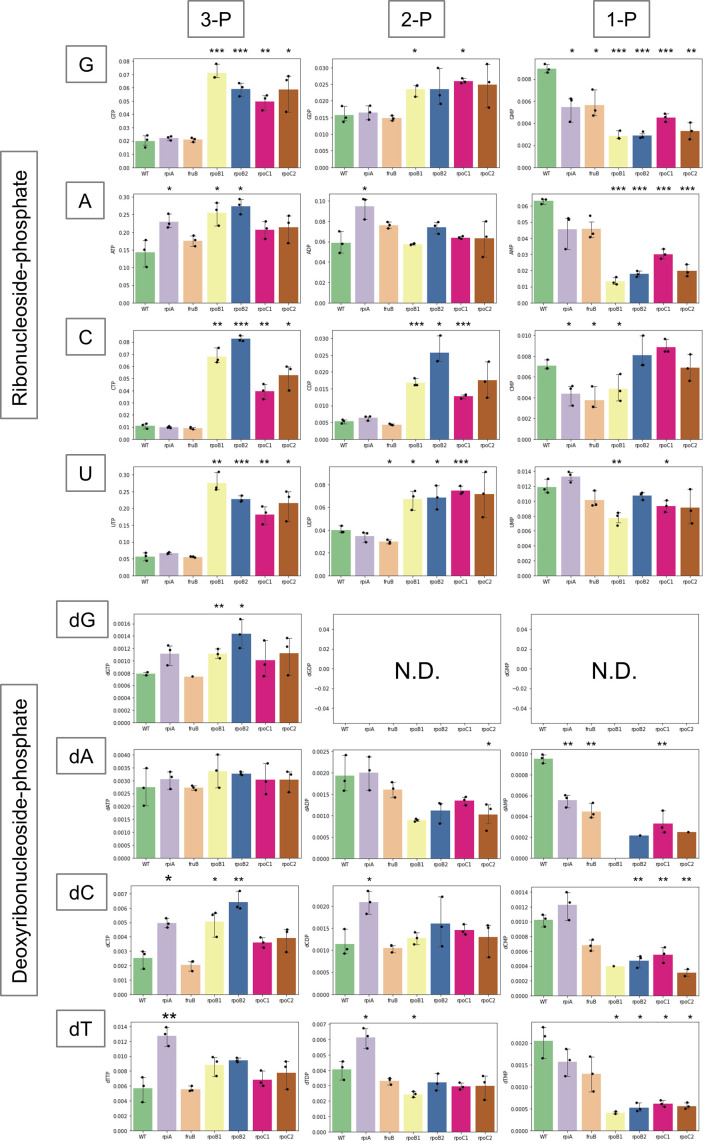
Fig 4.
Ribo/deoxyribonucleotide profile of JMUB217-derived mutants. Quantitative values of each ribo/deoxyribonucleotide of JMUB217-derived mutants with reduced oxacillin susceptibility: rpiA (JMUB217-7 RpiAA64E), fruB (JMUB217-13 FruBA211E), rpoB1 (JMUB217-23 RpoBH929P), rpoB2 (JMUB217-22 RpoBQ645H), rpoC1 (JMUB217-19 RpoCG950R), and rpoC2 (JMUB217-24 RpoCG498D). The y-axis represents the amount of intracellular ribo/deoxyribonucleotide (pmol) in 1 mL of cell suspension at OD600 = 1. Data represent means with standard error from three independent experiments. N.D., not detected. Mean values of intracellular ribo/deoxyribonucleotide of mutant strains were compared with that of wild-type via one-way ANOVA. *P < 0.05, **P < 0.01, and ***P < 0.001. Figures 3 to 5 and Fig. S1 were constructed from data of the same metabolomics analysis.

